Fig. 4
Download original image
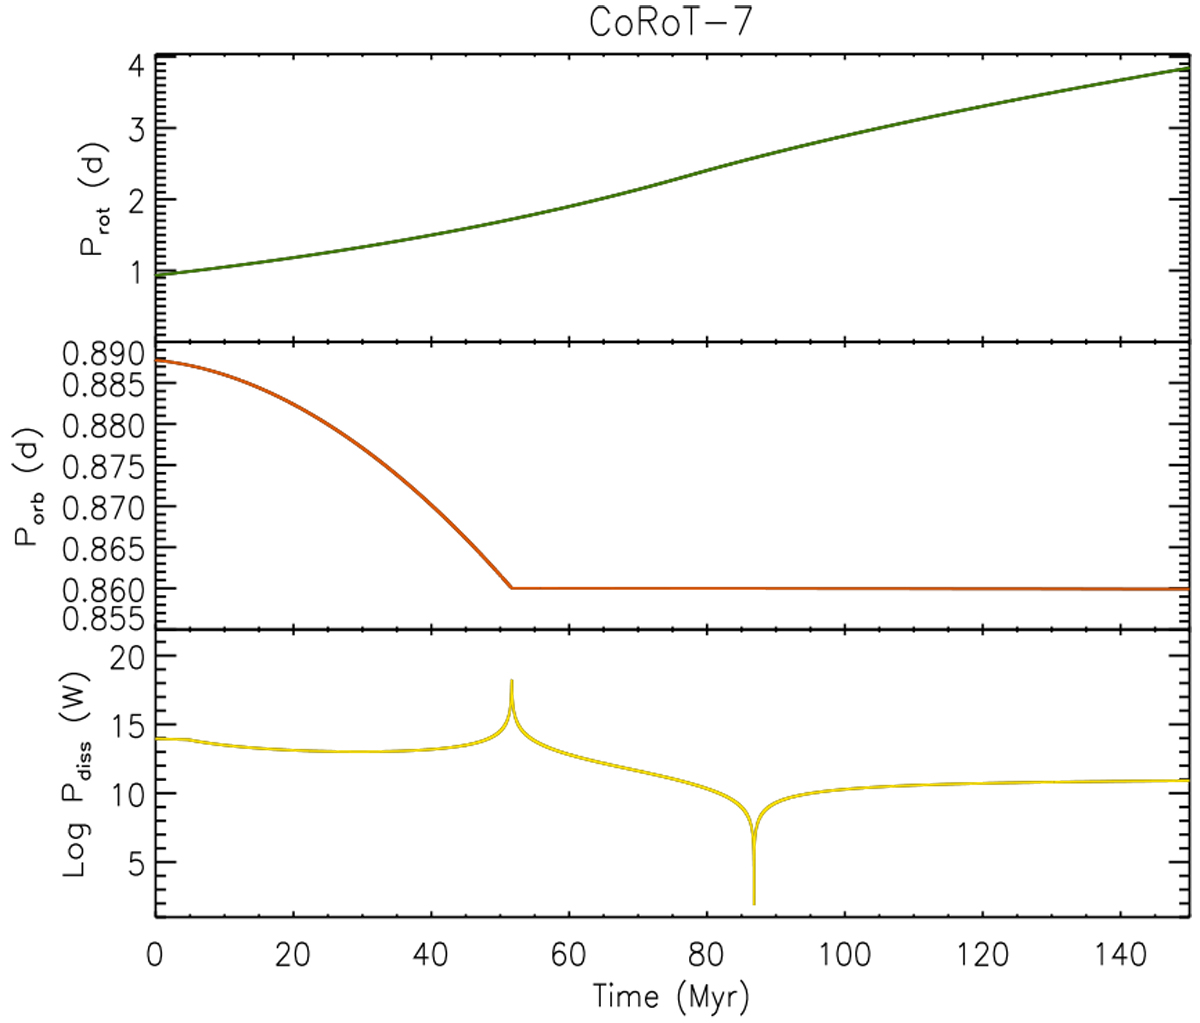
Upper panel: enlargement of the upper plot of Fig. 3 showing the rotation period of CoRoT-7 vs. the time as obtained from our model of the stellar angular momentum and tidal evolution introduced in Sect. 2.9. Middle panel: enlargement of the lower plot of Fig. 3, showing the orbital period of CoRoT-7b vs. the time. Lower panel: power dissipated inside CoRoT-7b vs. the time. The change in the slope of the curve showing the orbital period evolution occurs when Prot = 2Porb and corresponds to the limit beyond which inertial waves are no longer excited inside the star leading to a remarkable decrease of the tidal dissipation. The same condition corresponds to the resonant excitation of the radial oscillations and the intense dissipation inside the planet.
Current usage metrics show cumulative count of Article Views (full-text article views including HTML views, PDF and ePub downloads, according to the available data) and Abstracts Views on Vision4Press platform.
Data correspond to usage on the plateform after 2015. The current usage metrics is available 48-96 hours after online publication and is updated daily on week days.
Initial download of the metrics may take a while.