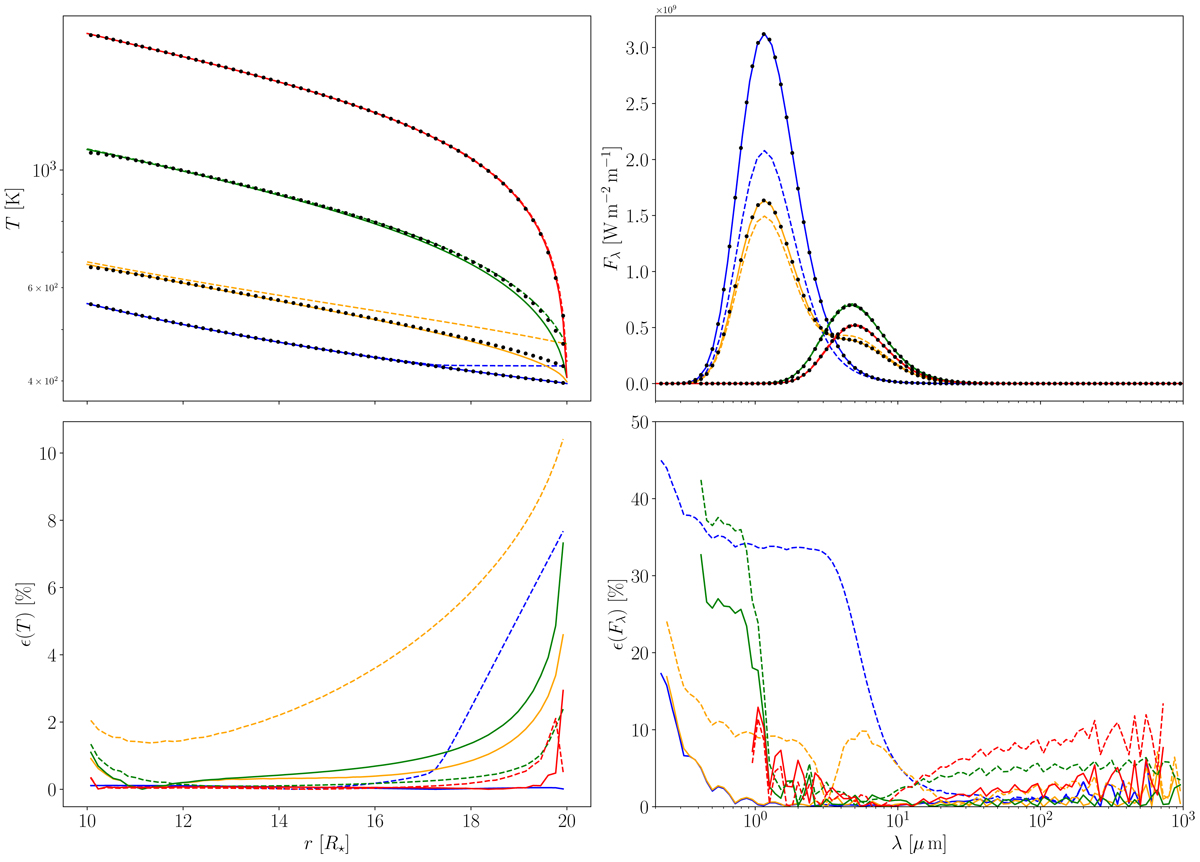
Fig. 4.
Download original image
Comparison of the outer boundary conditions presented here (solid lines) and from Levermore & Pomraning (1981) (dashed lines) for the test case presented in Sect. 5.2. The colour code is the same as in Fig. 3. The emerging fluxes are displayed in semi-log scale to highlight the differences between the BCs. The lower panels show the relative differences profiles with respect to the MC code from Niccolini & Alcolea (2006) in temperature (left) and in emerging flux (right).
Current usage metrics show cumulative count of Article Views (full-text article views including HTML views, PDF and ePub downloads, according to the available data) and Abstracts Views on Vision4Press platform.
Data correspond to usage on the plateform after 2015. The current usage metrics is available 48-96 hours after online publication and is updated daily on week days.
Initial download of the metrics may take a while.