Fig. 2.
Download original image
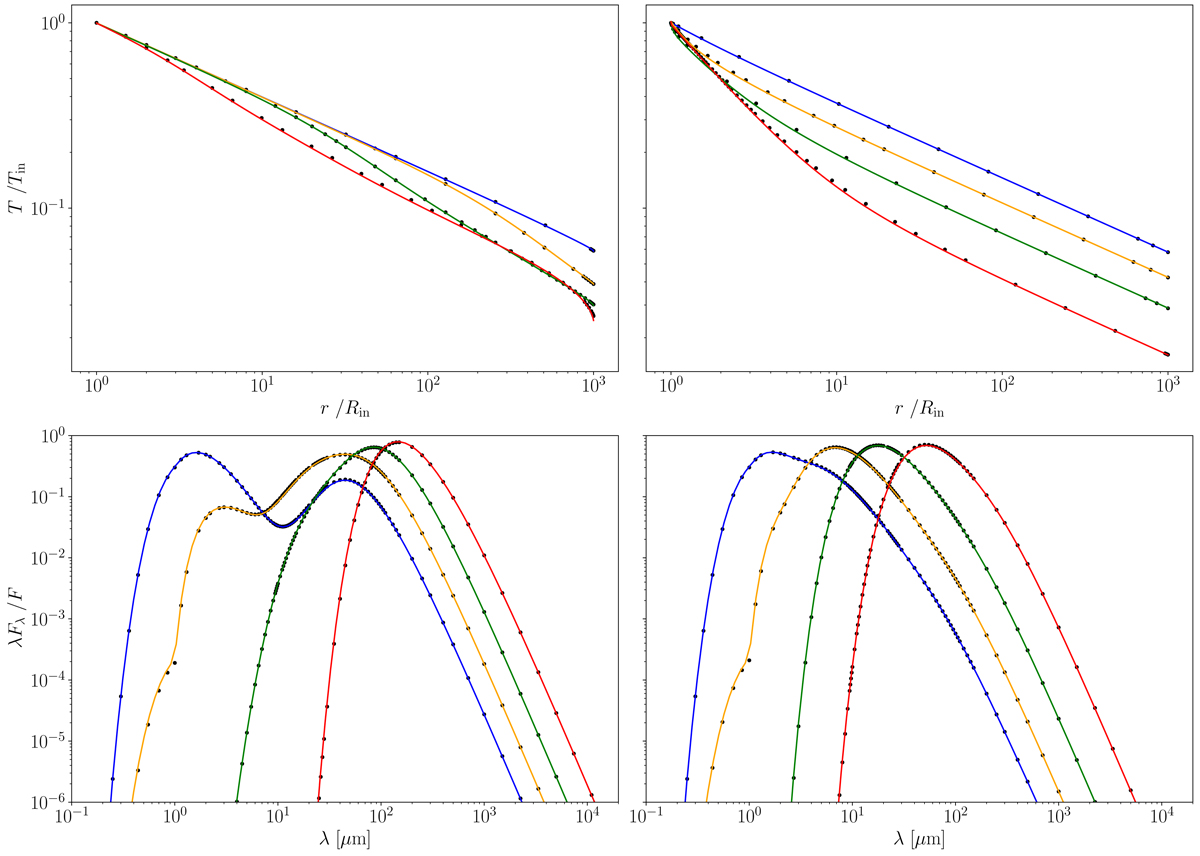
Non-grey case: normalised temperature profiles (upper panels) and SEDs (lower panels) for four different opacities τν0 = 1, 10, 100, and 1000 (blue, orange, green and red, respectively) and two density power laws: p = 0 (left panels) and p = 2 (right panels). The solid lines represent the FLD curves, and the black dots indicate the benchmark profiles from Ivezic et al. (1997).
Current usage metrics show cumulative count of Article Views (full-text article views including HTML views, PDF and ePub downloads, according to the available data) and Abstracts Views on Vision4Press platform.
Data correspond to usage on the plateform after 2015. The current usage metrics is available 48-96 hours after online publication and is updated daily on week days.
Initial download of the metrics may take a while.