Fig. 8
Download original image
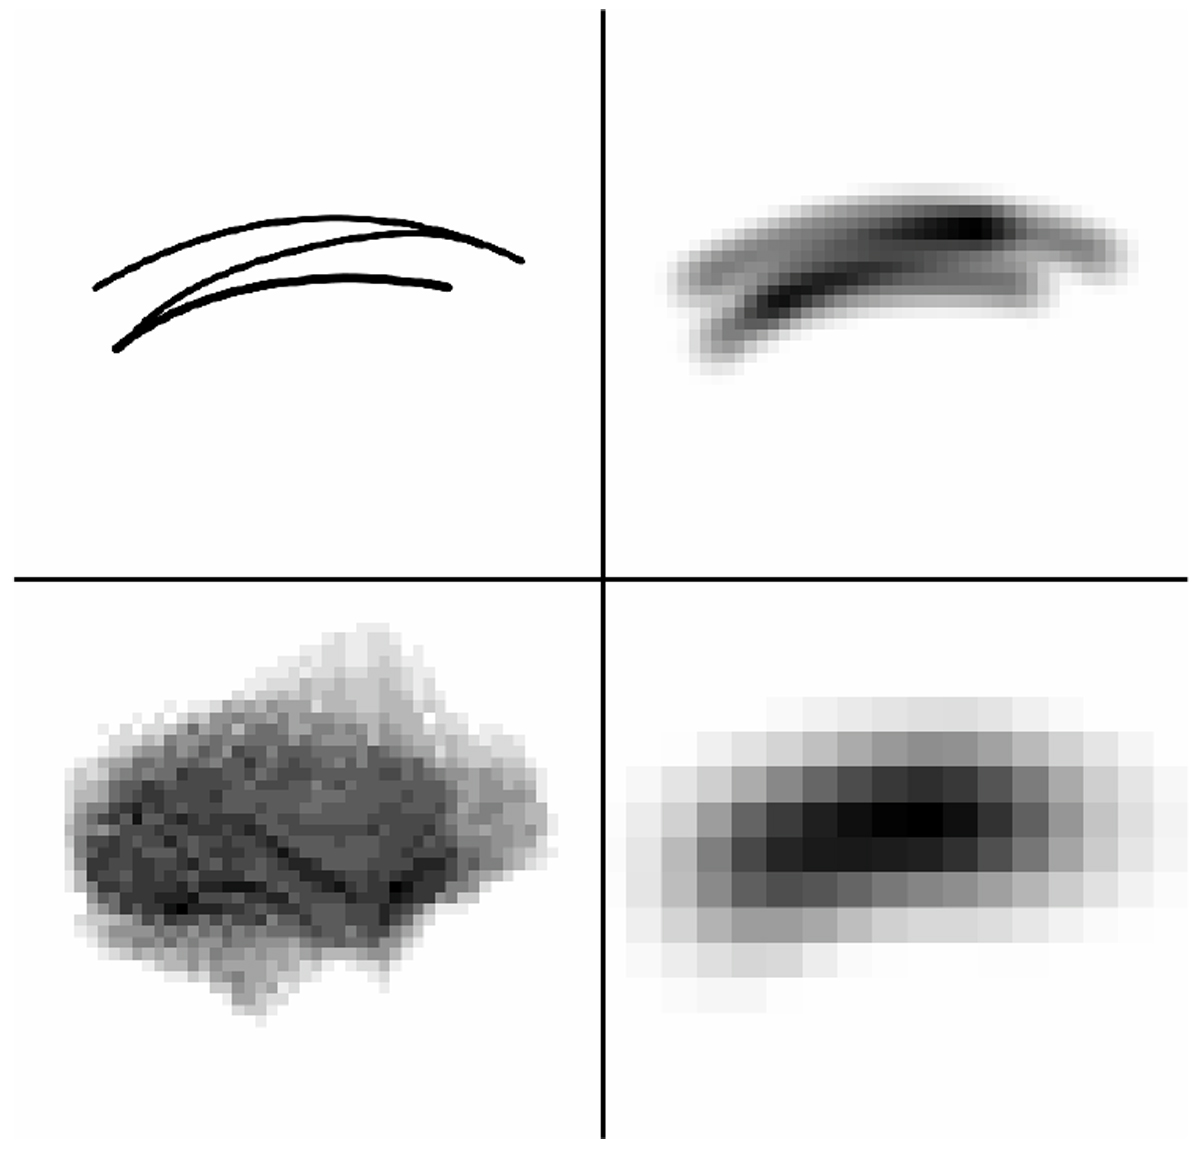
Several intersecting lines (top left), the |ψ2| Minkowski map at a window size large enough for an increased line density (top right), the resulting line density (bottom left), and the |ψ2| Minkowski map at triple window size (bottom right, same scale as the other Minkowski map). In spite of setting a low line density threshold, no part of the image is detected as a bubble because the decreasing |ψ2 | condition is not fulfilled.
Current usage metrics show cumulative count of Article Views (full-text article views including HTML views, PDF and ePub downloads, according to the available data) and Abstracts Views on Vision4Press platform.
Data correspond to usage on the plateform after 2015. The current usage metrics is available 48-96 hours after online publication and is updated daily on week days.
Initial download of the metrics may take a while.