Fig. 6
Download original image
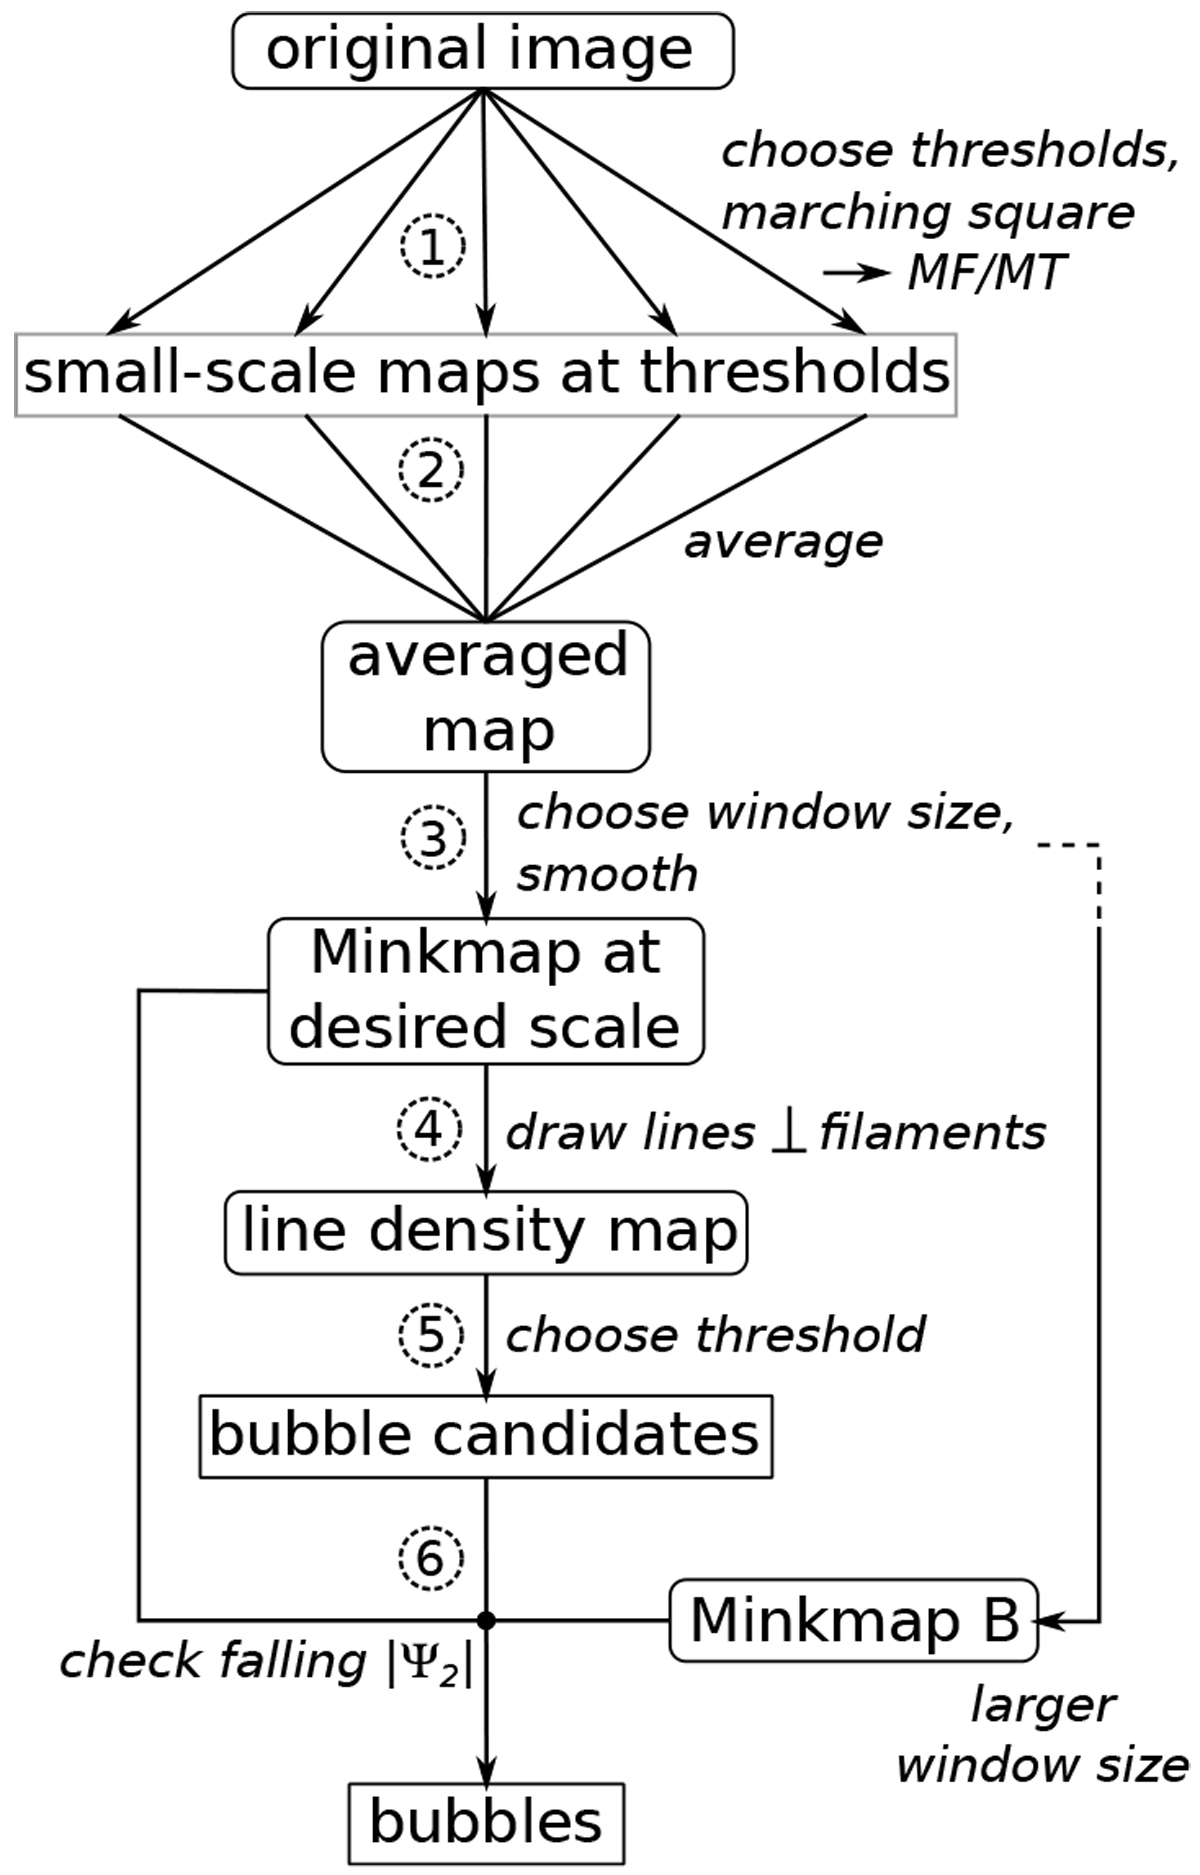
Our bubble detection process: create a Minkowski map by calculating marching-square maps at different thresholds (step 1), averaging them (step 2), and smoothing with a desired window size (step 3). For a ψ2 Minkowski map at one window size, draw lines perpendicular to filaments using arg(ψ2), whose length is proportional to |ψ2| and a chosen length factor (step 4). Counting the lines in each position gives a line density map. By choosing a suitable threshold here, we obtain the position of the bubble candidates (step 5). Then, |ψ2 | at the bubble positions should decrease for bubbles standing alone and rise at least not significantly if there are neighboring structures. This is checked by comparing to a Minkowski map at a suitable larger window size (step 6).
Current usage metrics show cumulative count of Article Views (full-text article views including HTML views, PDF and ePub downloads, according to the available data) and Abstracts Views on Vision4Press platform.
Data correspond to usage on the plateform after 2015. The current usage metrics is available 48-96 hours after online publication and is updated daily on week days.
Initial download of the metrics may take a while.