Fig. 4
Download original image
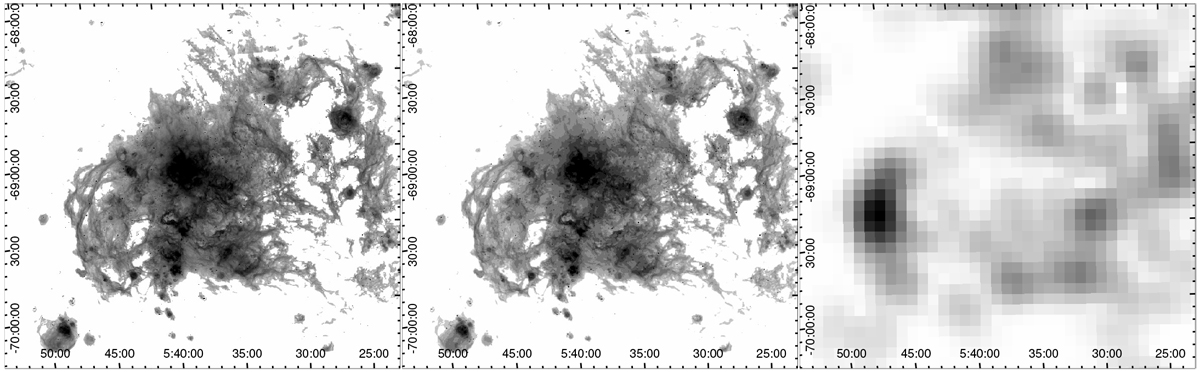
Hα image of a region in the LMC (left, logarithmic scale), thresholded image used to generate the Minkowski map (center), and the corresponding Minkowski map of |ψ2 | (right). The smoothing window size was six times the tile size in the right image. The first two images are limited to the minimum and maximum flux listed in Table 1.
Current usage metrics show cumulative count of Article Views (full-text article views including HTML views, PDF and ePub downloads, according to the available data) and Abstracts Views on Vision4Press platform.
Data correspond to usage on the plateform after 2015. The current usage metrics is available 48-96 hours after online publication and is updated daily on week days.
Initial download of the metrics may take a while.