Fig. A.2
Download original image
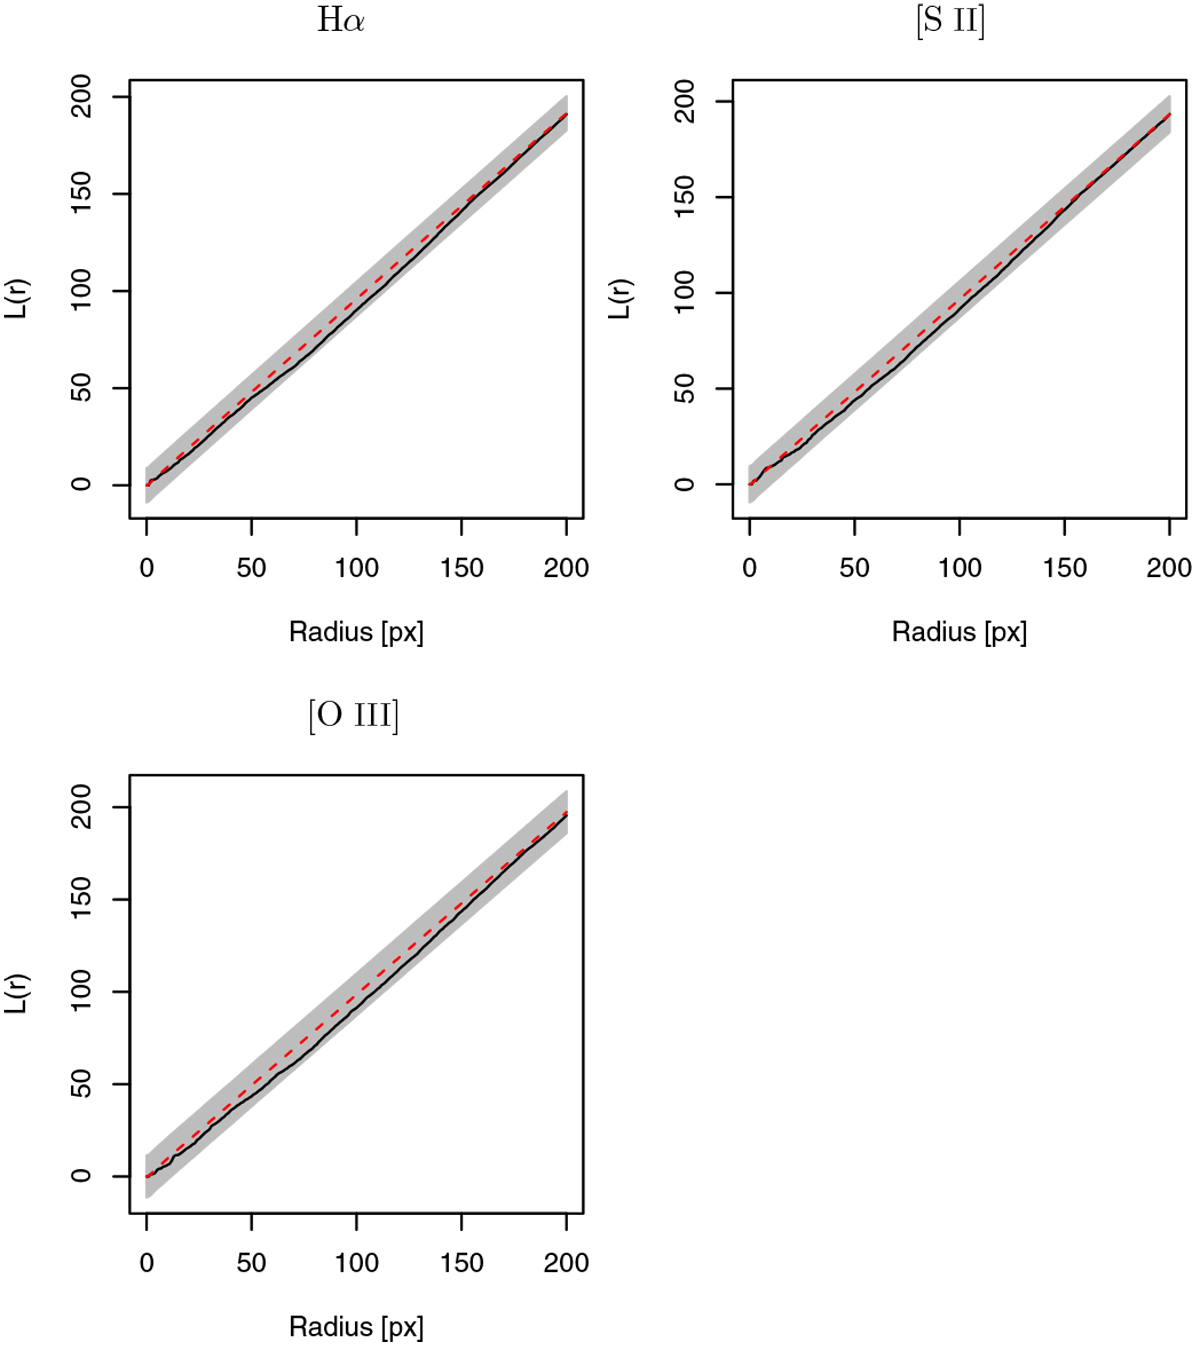
Bivariate Ripley’s L comparing the star formation rate 1 Gyr ago as calculated by Harris & Zaritsky (2009) and bubbles detected in Hα (top left), S II (top right), and O III (bottom) at window sizes of 12–70 px. Solid black line: L estimated from original pattern. Dashed red line: pointwise mean of half of the simulated patterns. Gray envelopes: MAD. 10 px corresponds to about 1.67′ or 24 pc at an LMC distance of 50 kpc.
Current usage metrics show cumulative count of Article Views (full-text article views including HTML views, PDF and ePub downloads, according to the available data) and Abstracts Views on Vision4Press platform.
Data correspond to usage on the plateform after 2015. The current usage metrics is available 48-96 hours after online publication and is updated daily on week days.
Initial download of the metrics may take a while.