Fig. 11
Download original image
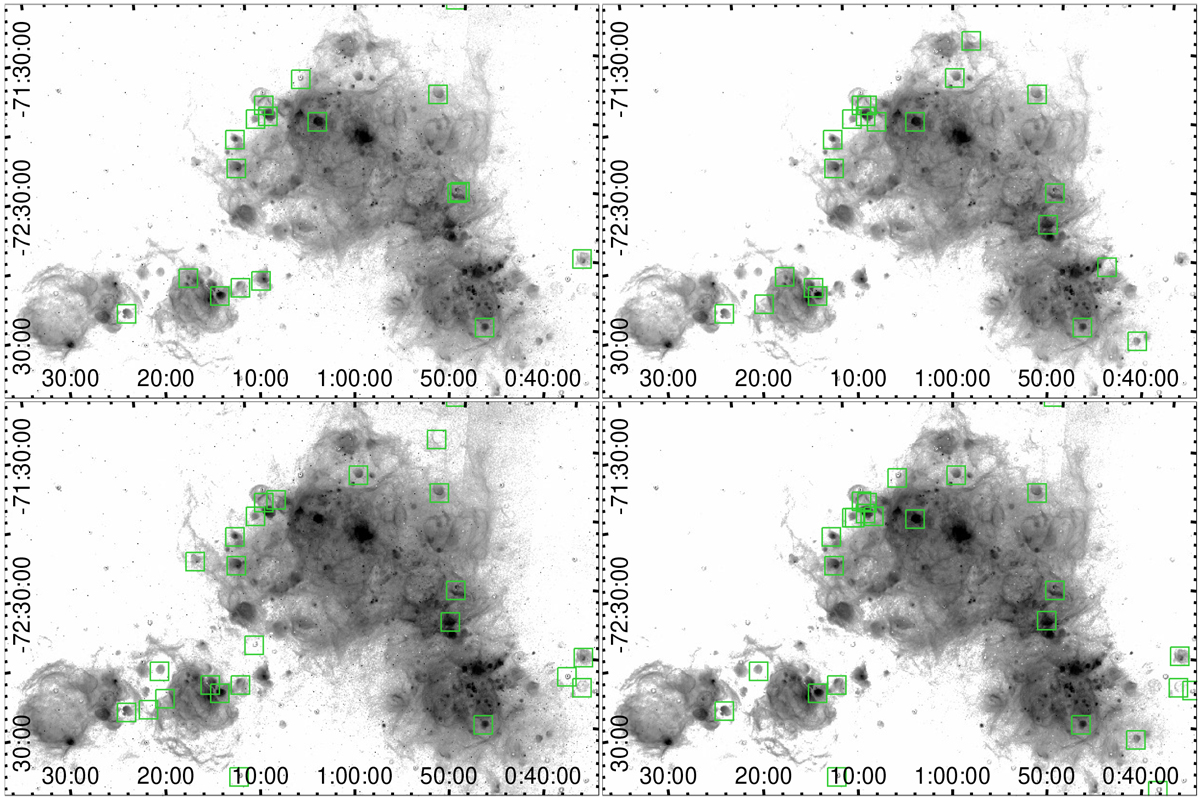
Bubbles detected at a window size 40 px (~72 pc), m = 0.3, line density threshold 10, in SMC Hα data. Top: Twelve thresholds between 6 and 2500. Bottom: Twelve thresholds between 3 and 1300 used for the Minkowski map generation. Left: original image opened with a diameter of 3 px (more noise). Right: opening diameter of 5 px (lessnoise). The brightness of the line emission is shown logarithmically within the respective minimum and maximum flux thresholds used for the Minkowski maps (Table 1).
Current usage metrics show cumulative count of Article Views (full-text article views including HTML views, PDF and ePub downloads, according to the available data) and Abstracts Views on Vision4Press platform.
Data correspond to usage on the plateform after 2015. The current usage metrics is available 48-96 hours after online publication and is updated daily on week days.
Initial download of the metrics may take a while.