Fig. 6
Download original image
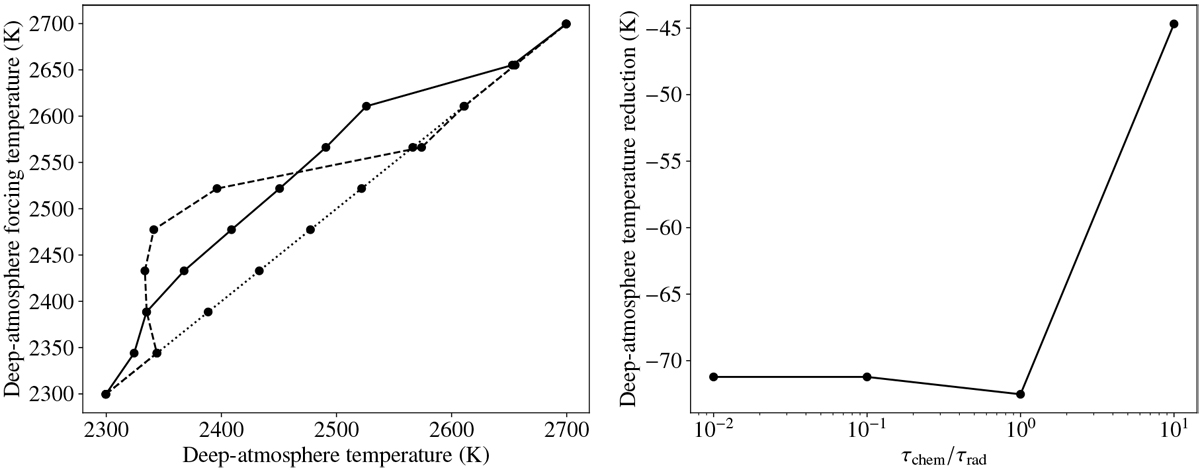
Deep-atmosphere forcing (equilibrium) temperature and the ratio of timescales explored, illustrating convergence. Left: relationship between the deep-atmosphere forcing (equilibrium) temperature and the resulting deep-atmosphere temperature. The dotted curve represents the initial adiabatic conditions. The solid curve illustrates the deviation from this due to the convective motion. The final profile shows a departure from the adiabatic branch towards the diabatic branch. The dashed curve highlights a transient early stage when the perturbation towards the diabatic branch is most pronounced. Right: ratio of the forcing timescales τchem ∕τrad for T0 = 2522 K with τchem = 1, 10, 100, and 1000 s; τrad = 100 s for all values. Convergence is reached once τchem∕τrad < 1.
Current usage metrics show cumulative count of Article Views (full-text article views including HTML views, PDF and ePub downloads, according to the available data) and Abstracts Views on Vision4Press platform.
Data correspond to usage on the plateform after 2015. The current usage metrics is available 48-96 hours after online publication and is updated daily on week days.
Initial download of the metrics may take a while.