Fig. 5
Download original image
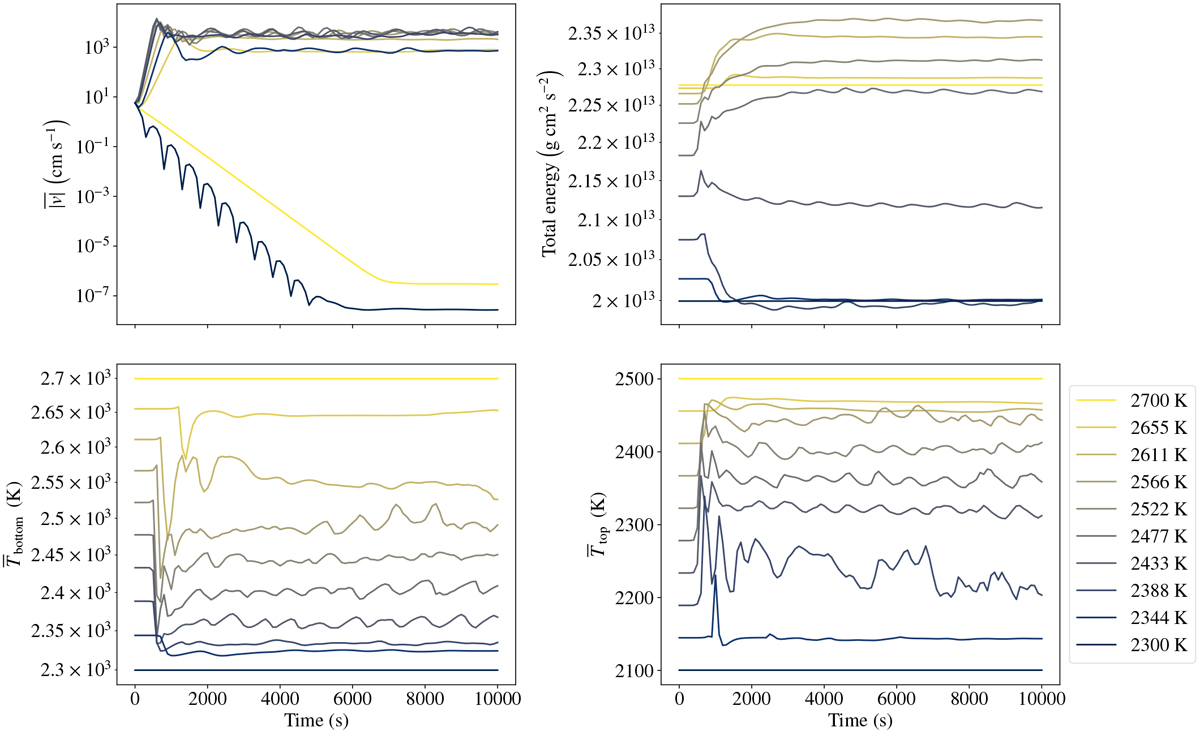
Time evolution of bulk fluid quantities over the course of the parameter study simulations. For each of the simulated deep-atmosphere temperatures (coloured from yellow to deep blue according to decreasing temperature), the average velocity magnitude, total energy, average deep-atmosphere temperature, and average temperature of the upper atmosphere are plotted. The behaviour of the average velocity magnitude is the primary metric for determining whether steady state has been reached. This occurs at 7000 s.
Current usage metrics show cumulative count of Article Views (full-text article views including HTML views, PDF and ePub downloads, according to the available data) and Abstracts Views on Vision4Press platform.
Data correspond to usage on the plateform after 2015. The current usage metrics is available 48-96 hours after online publication and is updated daily on week days.
Initial download of the metrics may take a while.