Fig. 4
Download original image
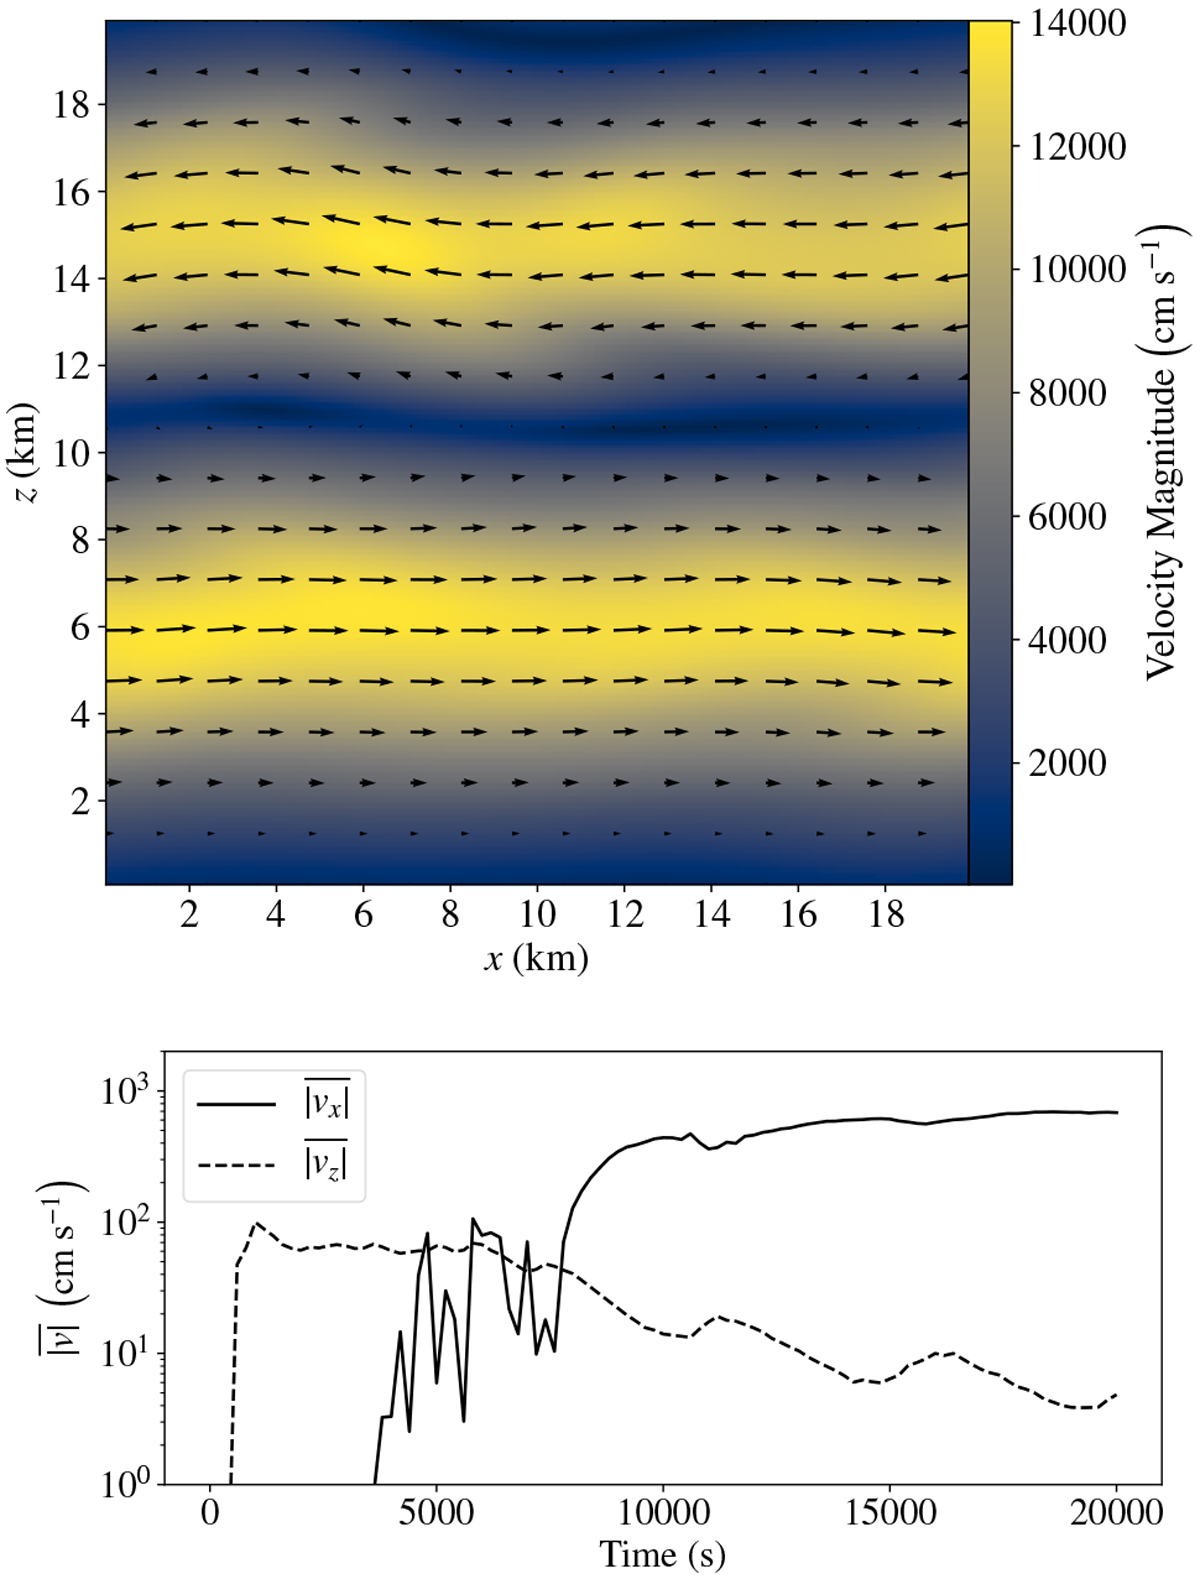
Illustration of the development of shear in 2D simulaitons. Top: velocity map from a 2D simulation illustrating the transition to shear. The quivers indicate the velocity direction and magnitude. There are two distinct regions of oppositely directed flow separated by a transition of approximately equal width. Bottom: time series of
![]() and
and ![]() showing the decay of the vertical component and the growth and saturation of the horizontal component. After a sufficient length of time (twice that of the 3D simulations), steady state has been reached and any convective motion is suppressed in favour of shear.
showing the decay of the vertical component and the growth and saturation of the horizontal component. After a sufficient length of time (twice that of the 3D simulations), steady state has been reached and any convective motion is suppressed in favour of shear.
Current usage metrics show cumulative count of Article Views (full-text article views including HTML views, PDF and ePub downloads, according to the available data) and Abstracts Views on Vision4Press platform.
Data correspond to usage on the plateform after 2015. The current usage metrics is available 48-96 hours after online publication and is updated daily on week days.
Initial download of the metrics may take a while.