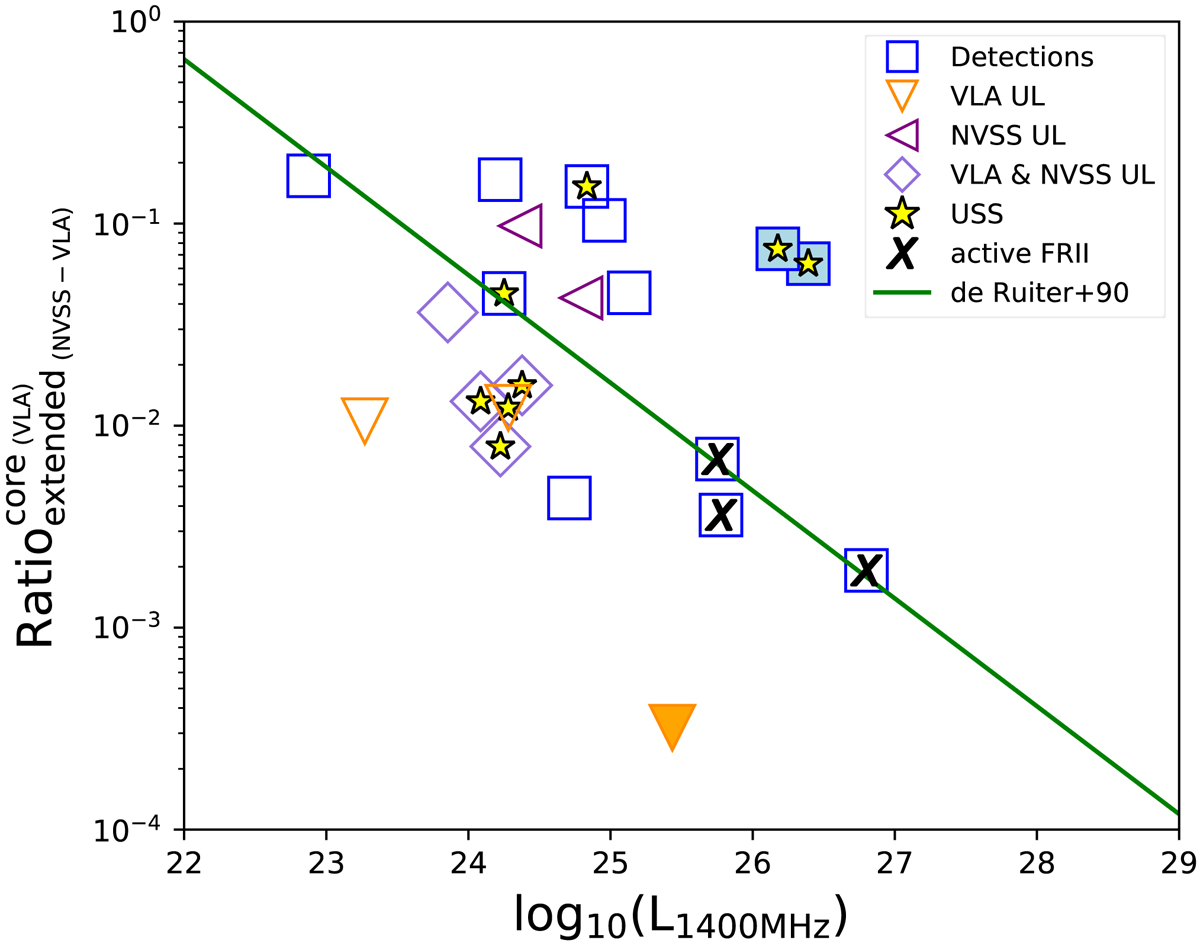
Fig. 4.
Download original image
Ratio of radio luminosity of the core and of extended emission as a function of total radio luminosity at 1400 MHz of 21 remnant candidates. The green line represents the relation from de Ruiter et al. (1990), corrected for H0. Markers filled with colour are the ones with less reliable redshift, affecting the total radio luminosity (see Table 1). Points filled with a yellow star symbol represent sources with USS. Sources with ‘✗’ written inside them are those with observed hotspots at 150 MHz (see Sect. 6.3). ‘UL’ in the legend stands for the ‘upper limit value’.
Current usage metrics show cumulative count of Article Views (full-text article views including HTML views, PDF and ePub downloads, according to the available data) and Abstracts Views on Vision4Press platform.
Data correspond to usage on the plateform after 2015. The current usage metrics is available 48-96 hours after online publication and is updated daily on week days.
Initial download of the metrics may take a while.