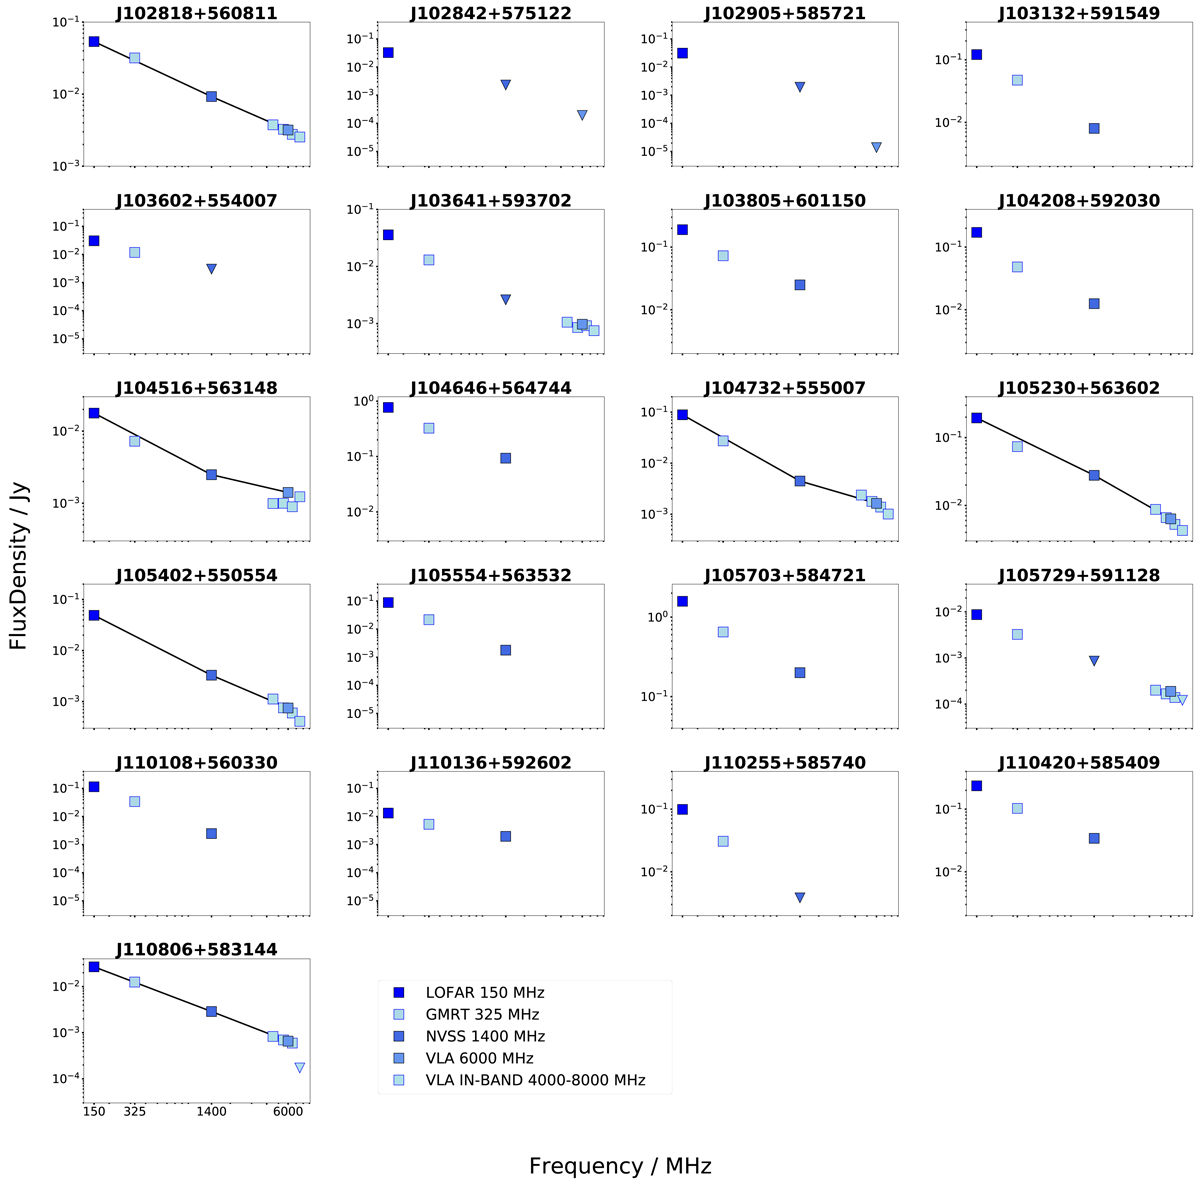
Fig. B.2.
Download original image
Radio spectra of the total emission of the remnant candidates. Flux densities from LOFAR18 at 150, NVSS at 1400 and VLA at 6000 MHz are shown with darker blue symbols, while GMRT at 325 MHz and VLA in-band spectral measurements centred at 4500, 5500, 6500 and 7500 MHz are shown in lighter blue symbols. For the source J1057+5911, we use the WSRT upper limit at 1400 MHz. Upper limits are indicated with triangles. The black line connects the measurements used for the calculation of the spectral index for sources detected at 150, 1400 and 6000 MHz. Flux density scale errors are smaller than the size of the symbol representing the flux density measurement.
Current usage metrics show cumulative count of Article Views (full-text article views including HTML views, PDF and ePub downloads, according to the available data) and Abstracts Views on Vision4Press platform.
Data correspond to usage on the plateform after 2015. The current usage metrics is available 48-96 hours after online publication and is updated daily on week days.
Initial download of the metrics may take a while.