Fig. 5
Download original image
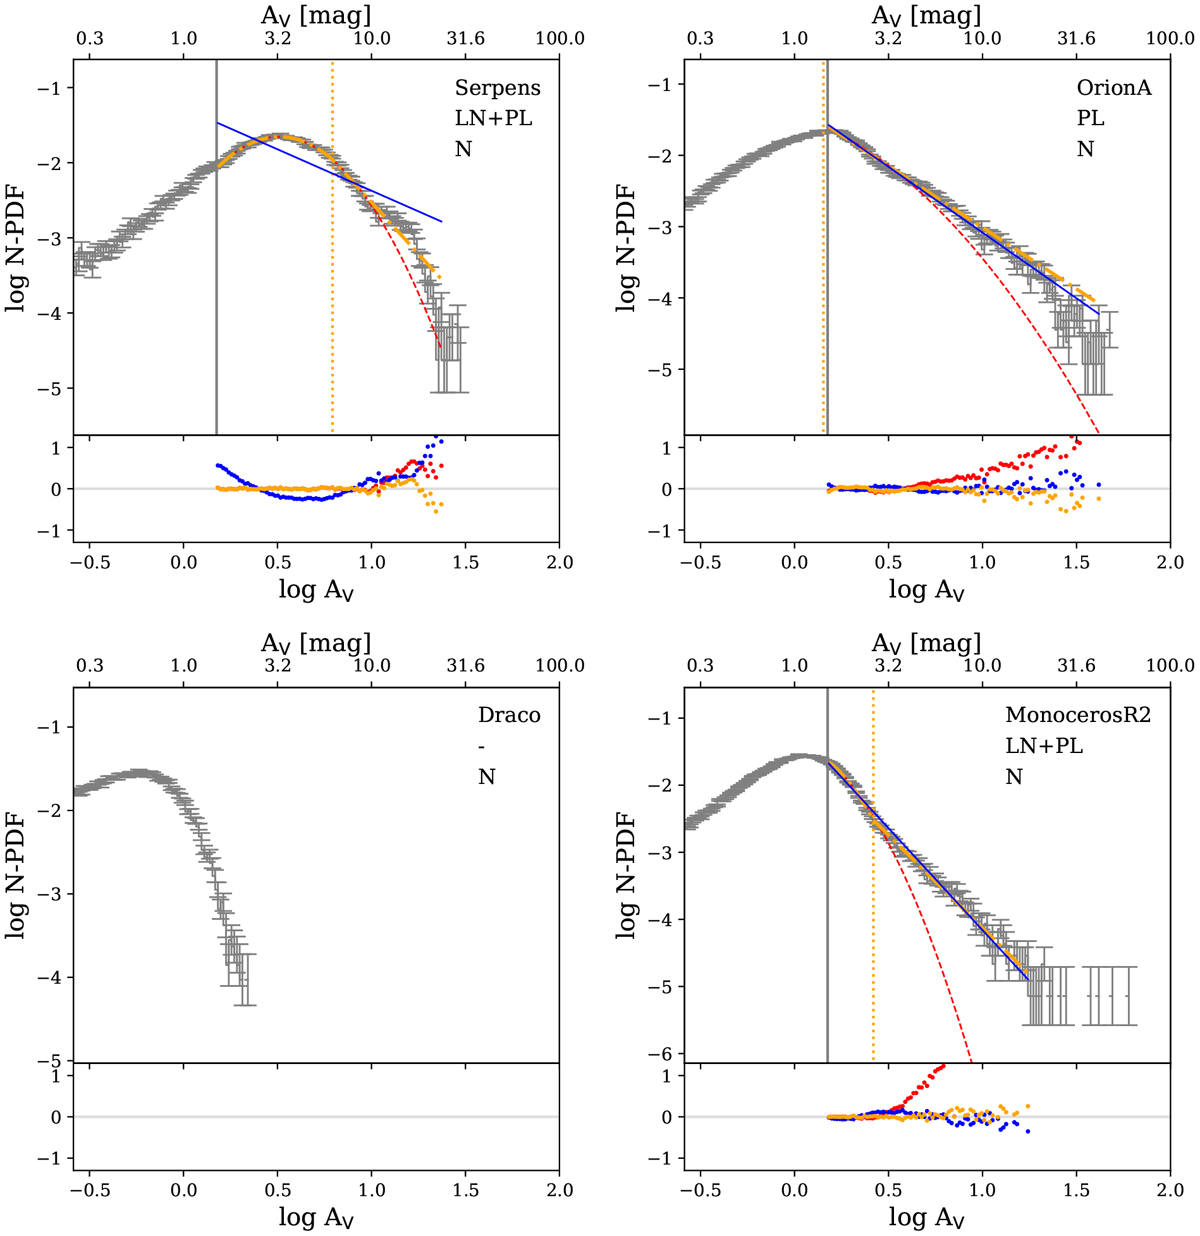
Examples of the N-PDFs of individual clouds. Those used in the analysis are shown in dark grey, and the column density mapused is noted in the legend: N for NICEST (all of these). The blue, red, and yellow lines show the fits of PL, LN, and LN+PL models, respectively. The transition point of the LN+PL model is shown with a vertical dotted yellow line. All fits were performed above the extinction at the last closed contour, which is marked with the vertical grey line. The residuals of the fitted models are shown below the N-PDFs, and the best-fit model is noted in the legend.
Current usage metrics show cumulative count of Article Views (full-text article views including HTML views, PDF and ePub downloads, according to the available data) and Abstracts Views on Vision4Press platform.
Data correspond to usage on the plateform after 2015. The current usage metrics is available 48-96 hours after online publication and is updated daily on week days.
Initial download of the metrics may take a while.