Fig. 4
Download original image
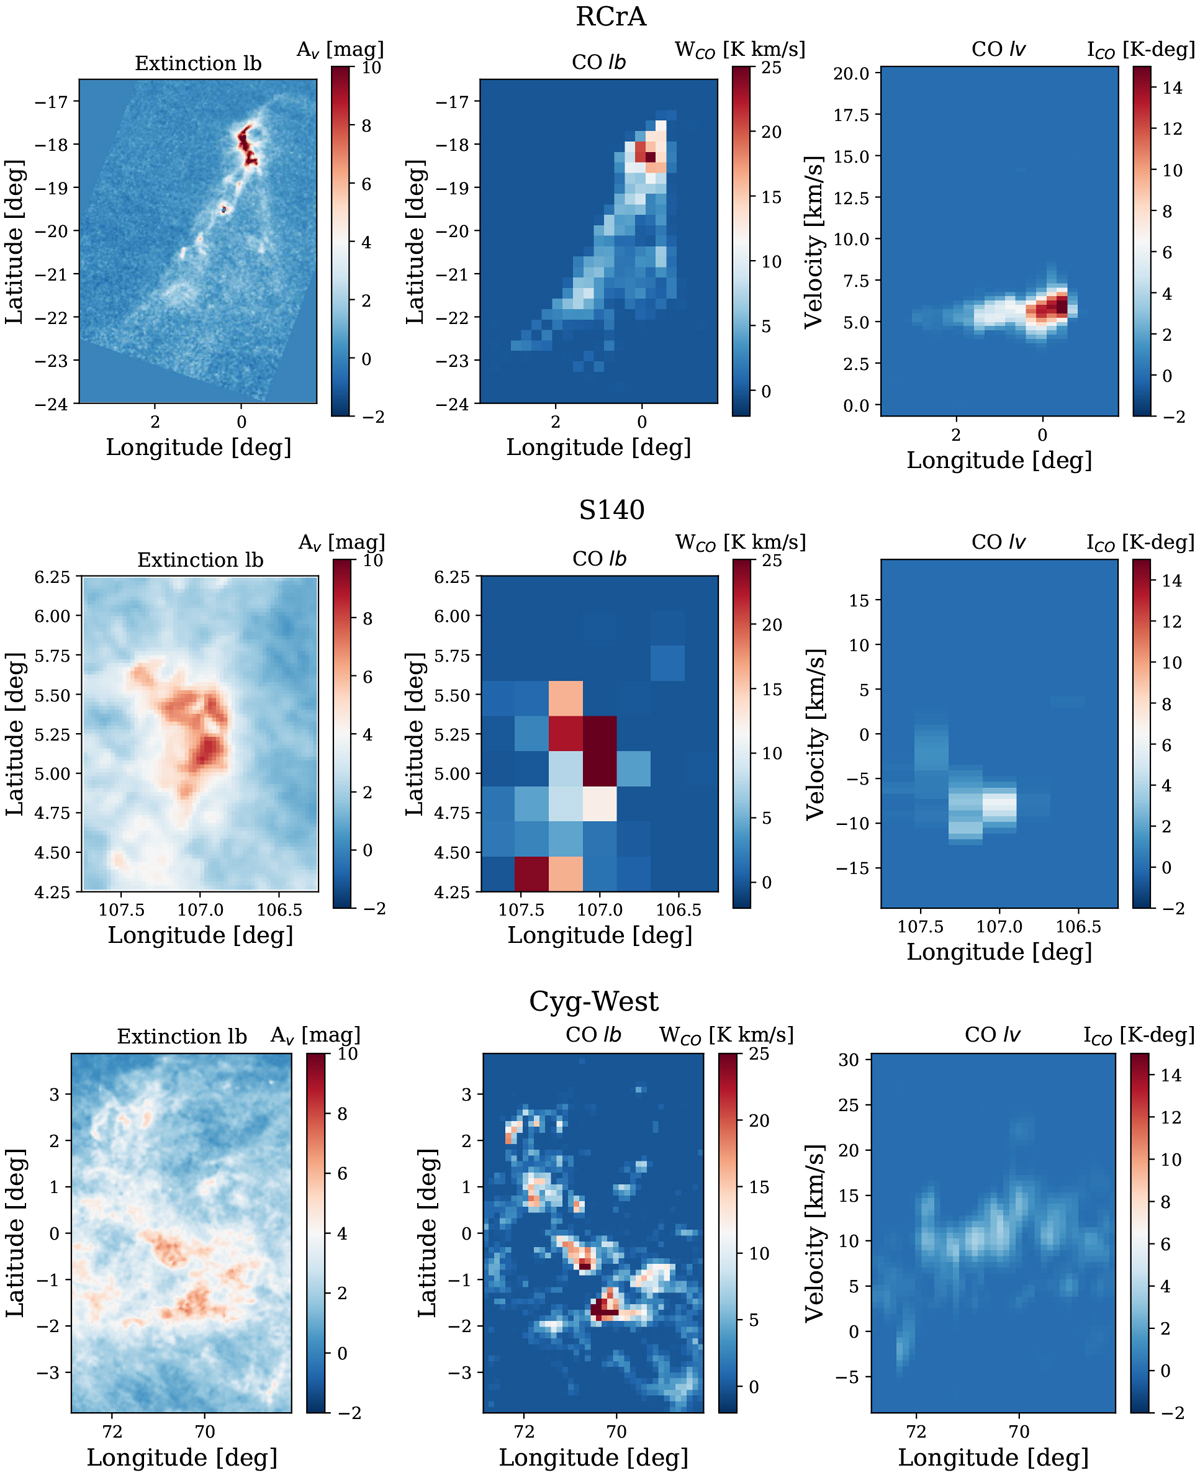
Three of the molecular clouds in our sample, seen in extinction and in CO position and velocity. CO is taken from Dame et al. (2001) survey, and the extinction is adopted from Kainulainen et al. (2009, 2014) for RCrA and from Juvela & Montillaud (2016) for S140 and Cyg-West. Extinction maps for all the clouds are shown in Figs. B.1–B.4.
Current usage metrics show cumulative count of Article Views (full-text article views including HTML views, PDF and ePub downloads, according to the available data) and Abstracts Views on Vision4Press platform.
Data correspond to usage on the plateform after 2015. The current usage metrics is available 48-96 hours after online publication and is updated daily on week days.
Initial download of the metrics may take a while.