Fig. E.3
Download original image
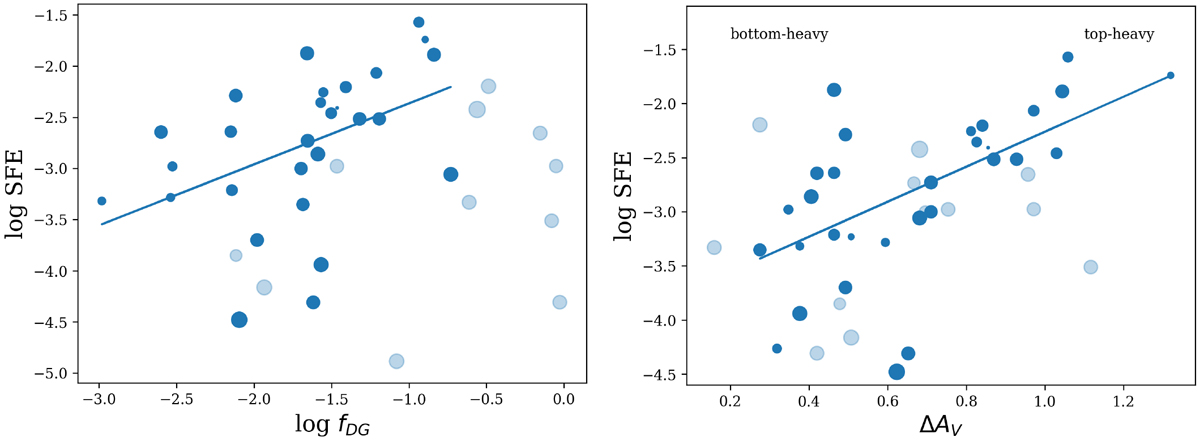
Relation between SFE and the dense gas measures of individual clouds. Light blue shows clouds with a distance > 1.2 kpc. The symbol size corresponds to the cloud area > 3mag. Left: Dense gas mass fraction, fDG, versus SFE. The line shows a fit with a = 0.6 ± 0.2, similar to the relation found previously for nearby molecular clouds (e.g. Kainulainen et al. 2014). Right: Relative density contrast, ΔAV, versus SFE. The line shows the fit of SFE ∝ 10aΔAV with a = 1.6 ± 0.4.
Current usage metrics show cumulative count of Article Views (full-text article views including HTML views, PDF and ePub downloads, according to the available data) and Abstracts Views on Vision4Press platform.
Data correspond to usage on the plateform after 2015. The current usage metrics is available 48-96 hours after online publication and is updated daily on week days.
Initial download of the metrics may take a while.