Free Access
Fig. 18
Download original image
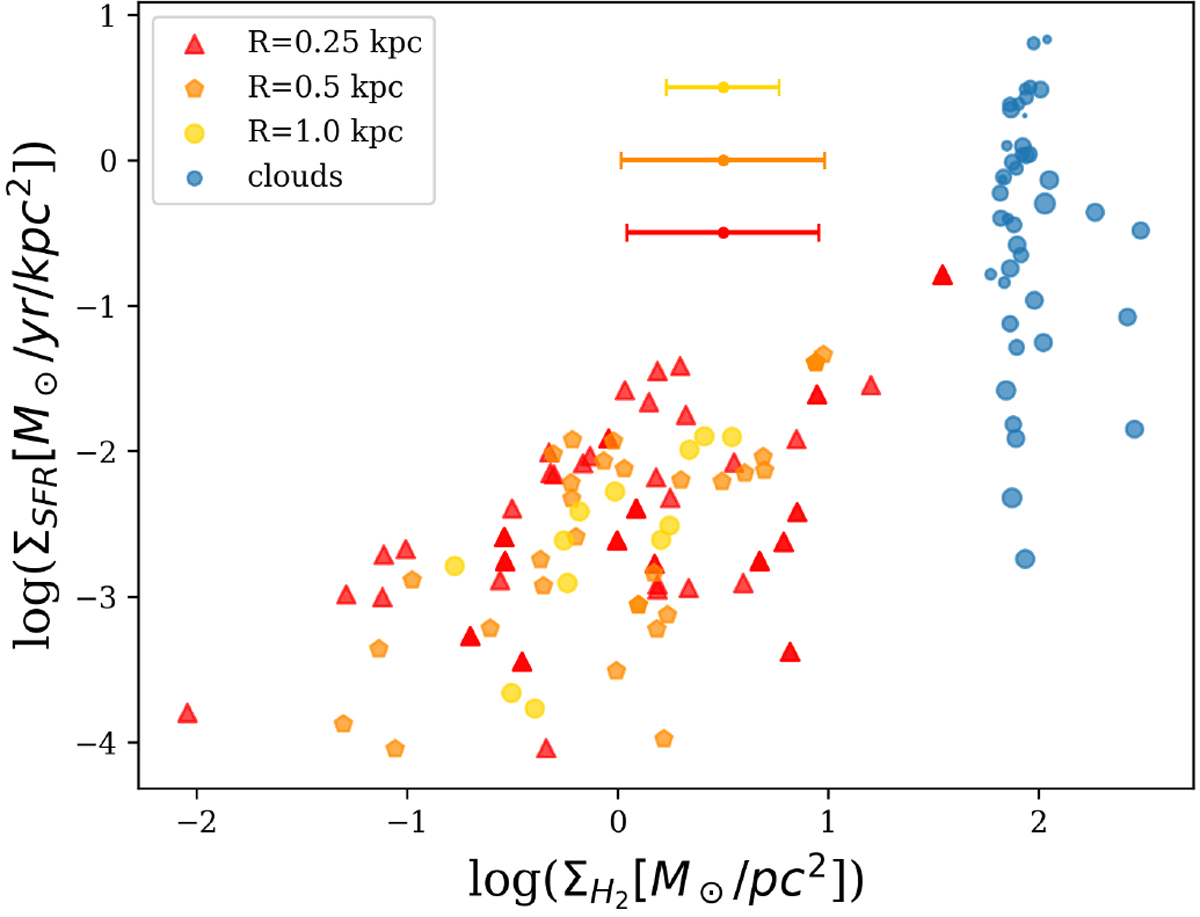
Kennicutt-Schmidt relation for apertures of radius 1 kpc (yellow circles), 0.5 kpc (orange pentagons), 0.25 kpc (red triangles), and the individual clouds (blue circles, size corresponds to cloud area). The error bars show the standard deviation of the x-axis (gas surface density) of the apertures.
Current usage metrics show cumulative count of Article Views (full-text article views including HTML views, PDF and ePub downloads, according to the available data) and Abstracts Views on Vision4Press platform.
Data correspond to usage on the plateform after 2015. The current usage metrics is available 48-96 hours after online publication and is updated daily on week days.
Initial download of the metrics may take a while.