Free Access
Fig. 11
Download original image
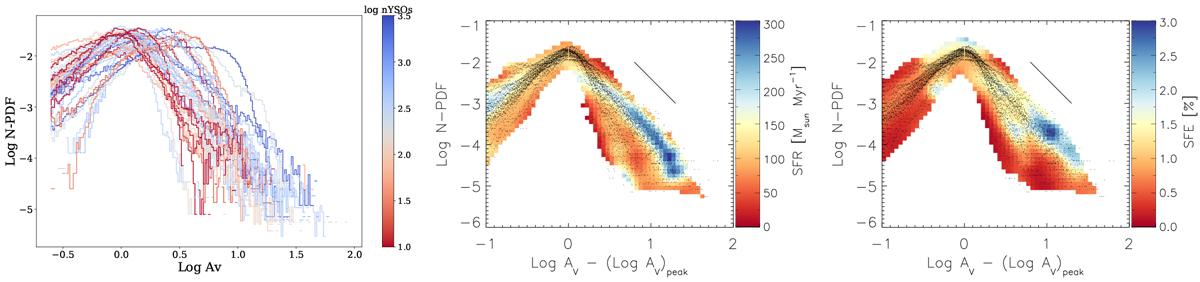
N-PDFs of the individual clouds with RGal > 7.5 kpc for which the SFR is known. Left: N-PDFs colour-coded with the SFR. Centre: peak-matched N-PDFs with background colour-coding that shows the mean SFR of the N-PDFs at a given location. Right: the same for the SFE. The black lines denote a power law with slope −2.
Current usage metrics show cumulative count of Article Views (full-text article views including HTML views, PDF and ePub downloads, according to the available data) and Abstracts Views on Vision4Press platform.
Data correspond to usage on the plateform after 2015. The current usage metrics is available 48-96 hours after online publication and is updated daily on week days.
Initial download of the metrics may take a while.