Fig. 8.
Download original image
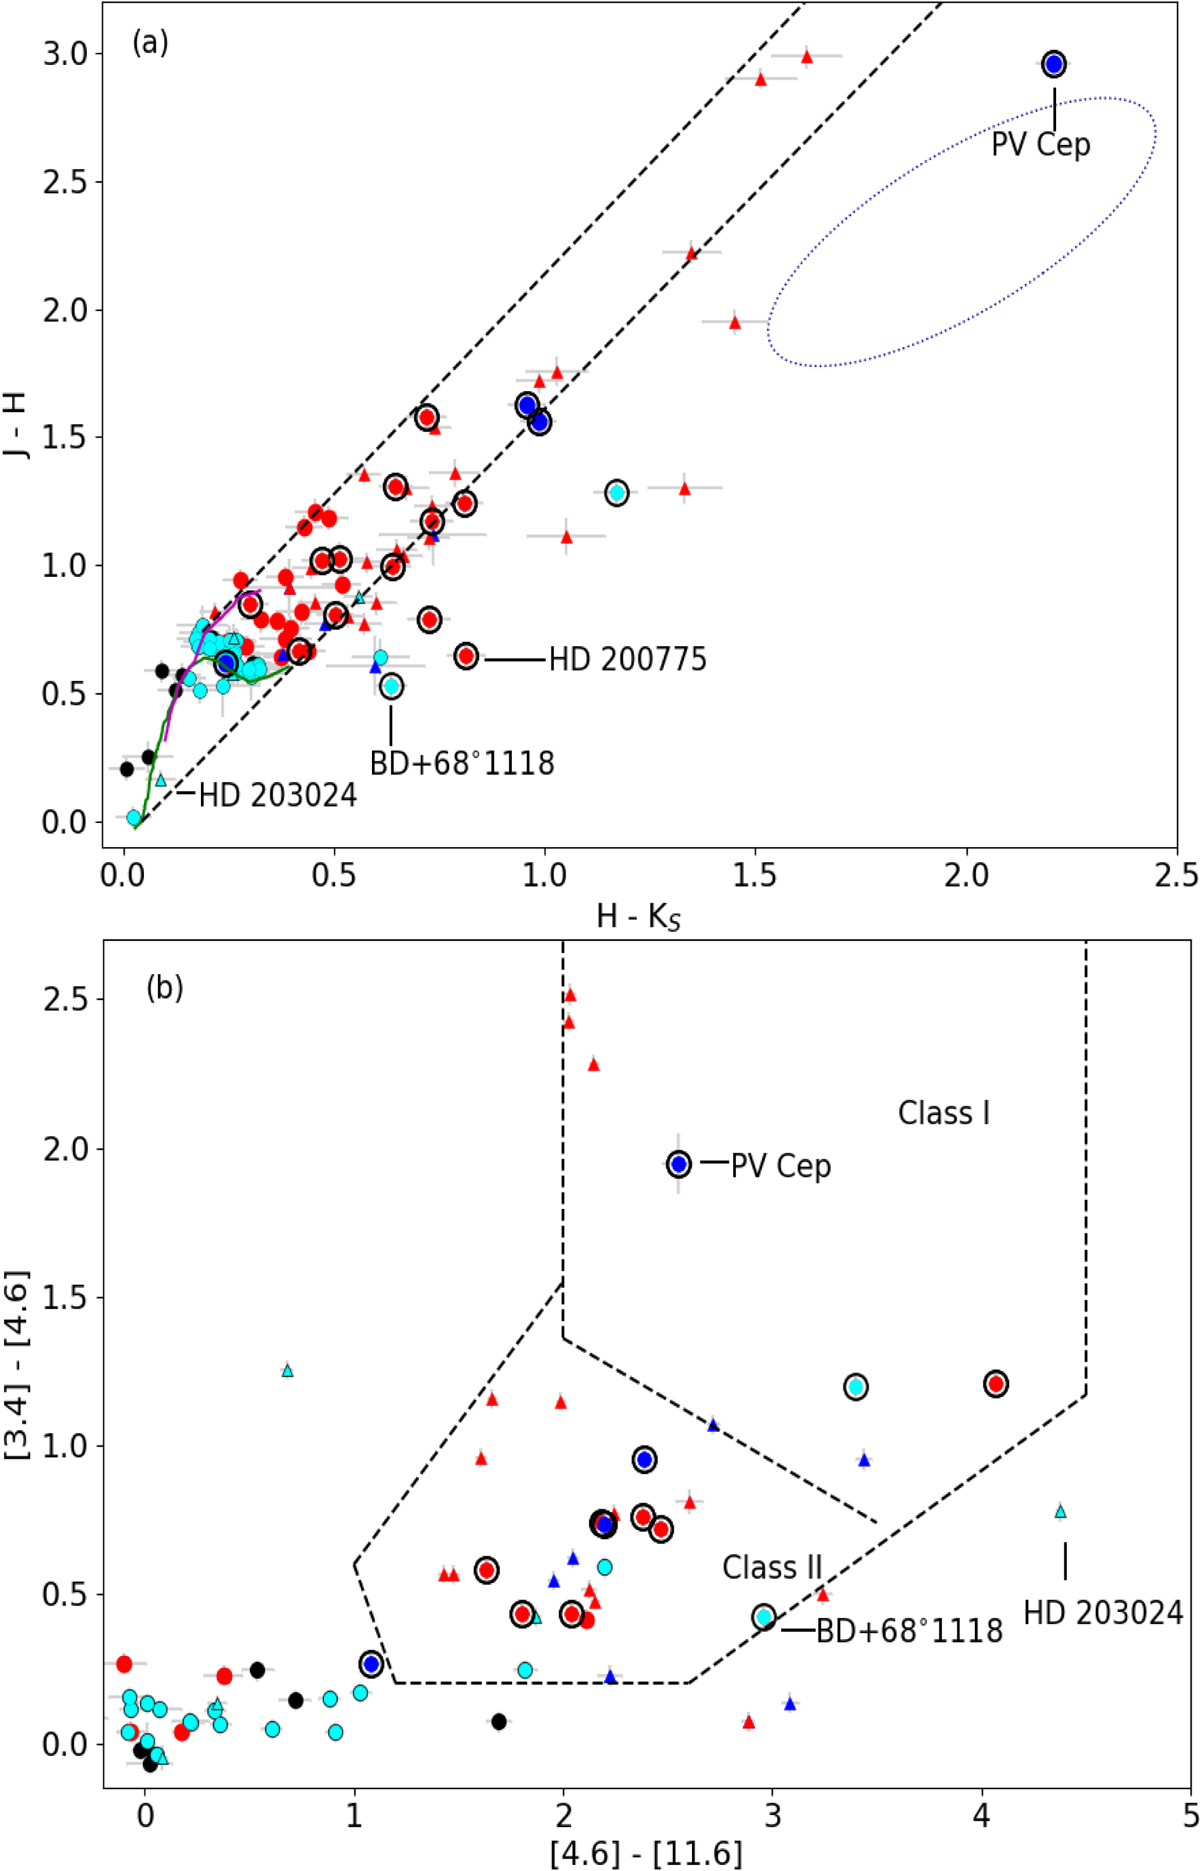
Near- and mid-IR CC diagrams for the known YSO candidates and the newly identified co-moving sources. Symbols are the same as presented in Fig. 7. (a) (J − H) vs. (H − KS) CC diagram of the sources. The solid curves in green and magenta represent the loci of the un-reddened main sequence stars and the giants (Maheswar et al. 2010), respectively. The ellipse represents the range of variability of PV Cep, based on the time series observations by Lorenzetti et al. (2011). (b) WISE CC diagram of the sources. The dashed lines separate the regions occupied by the Class I and Class II sources (Koenig & Leisawitz 2014).
Current usage metrics show cumulative count of Article Views (full-text article views including HTML views, PDF and ePub downloads, according to the available data) and Abstracts Views on Vision4Press platform.
Data correspond to usage on the plateform after 2015. The current usage metrics is available 48-96 hours after online publication and is updated daily on week days.
Initial download of the metrics may take a while.