Fig. 6.
Download original image
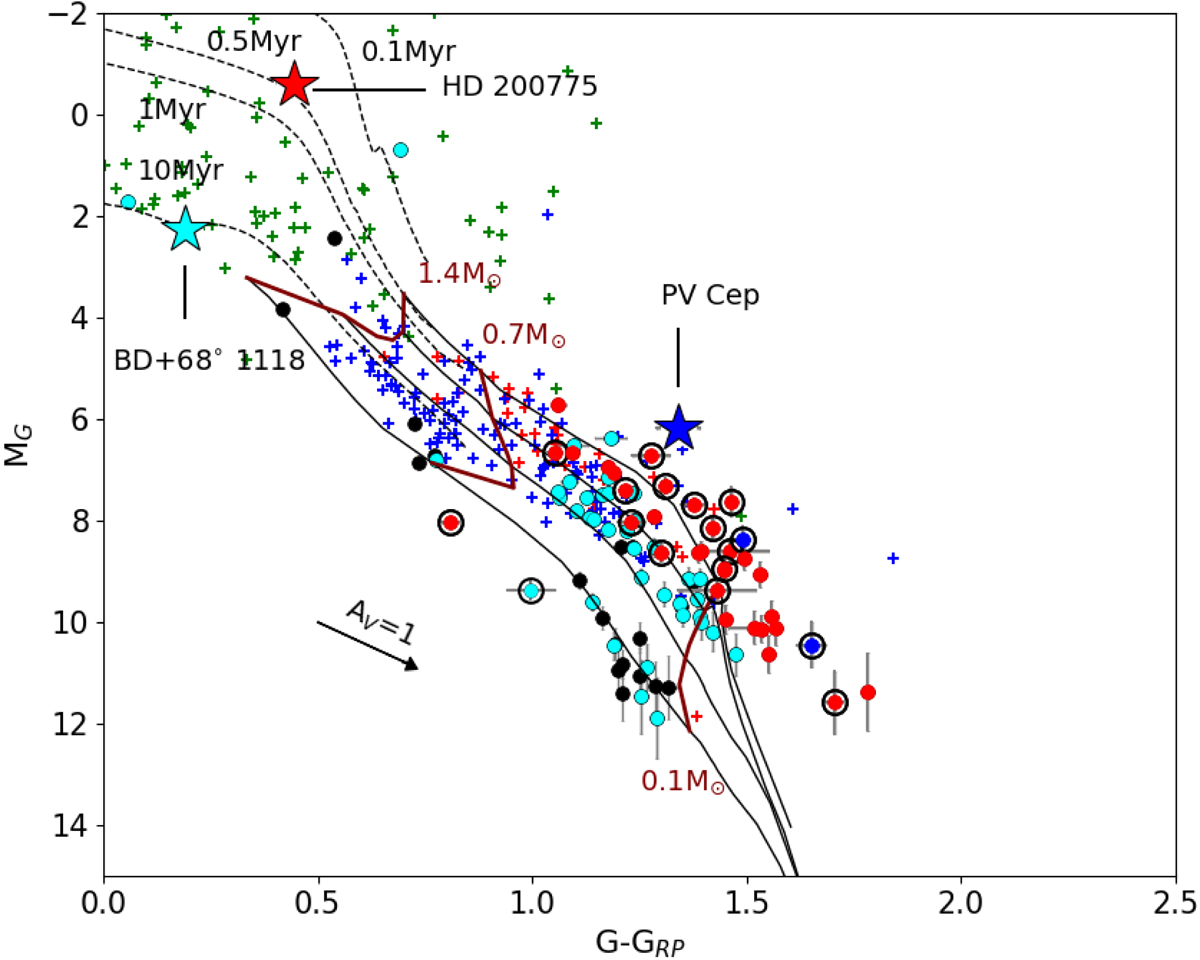
MG vs. (G − GRP) color-magnitude plot of the YSO candidates and the co-moving sources. The dashed lines indicate the isochrones from PARSEC models (Marigo et al. 2017) for 0.1, 0.5, 1, and 10 Myr. The solid curves represent the same from CIFIST models (Baraffe et al. 2015) for 1, 3, 10, and 60 Myr. Filled blue, red, and cyan circles are the YSO candidates that have reliable Gaia DR2 data (with open black circles) or co-moving sources (without open black circles) toward L1147/1158 (PV Cep), L1172/1174 (HD 200775), and L1177 (BD+68°1118), respectively. The co-moving sources not associated with any of the cloud complexes are presented using filled black circles. The green, red, and blue plus symbols indicate the HAeBe stars, CTTSs, and WTTSs, respectively. The arrow represents an extinction of 1 magnitude.
Current usage metrics show cumulative count of Article Views (full-text article views including HTML views, PDF and ePub downloads, according to the available data) and Abstracts Views on Vision4Press platform.
Data correspond to usage on the plateform after 2015. The current usage metrics is available 48-96 hours after online publication and is updated daily on week days.
Initial download of the metrics may take a while.