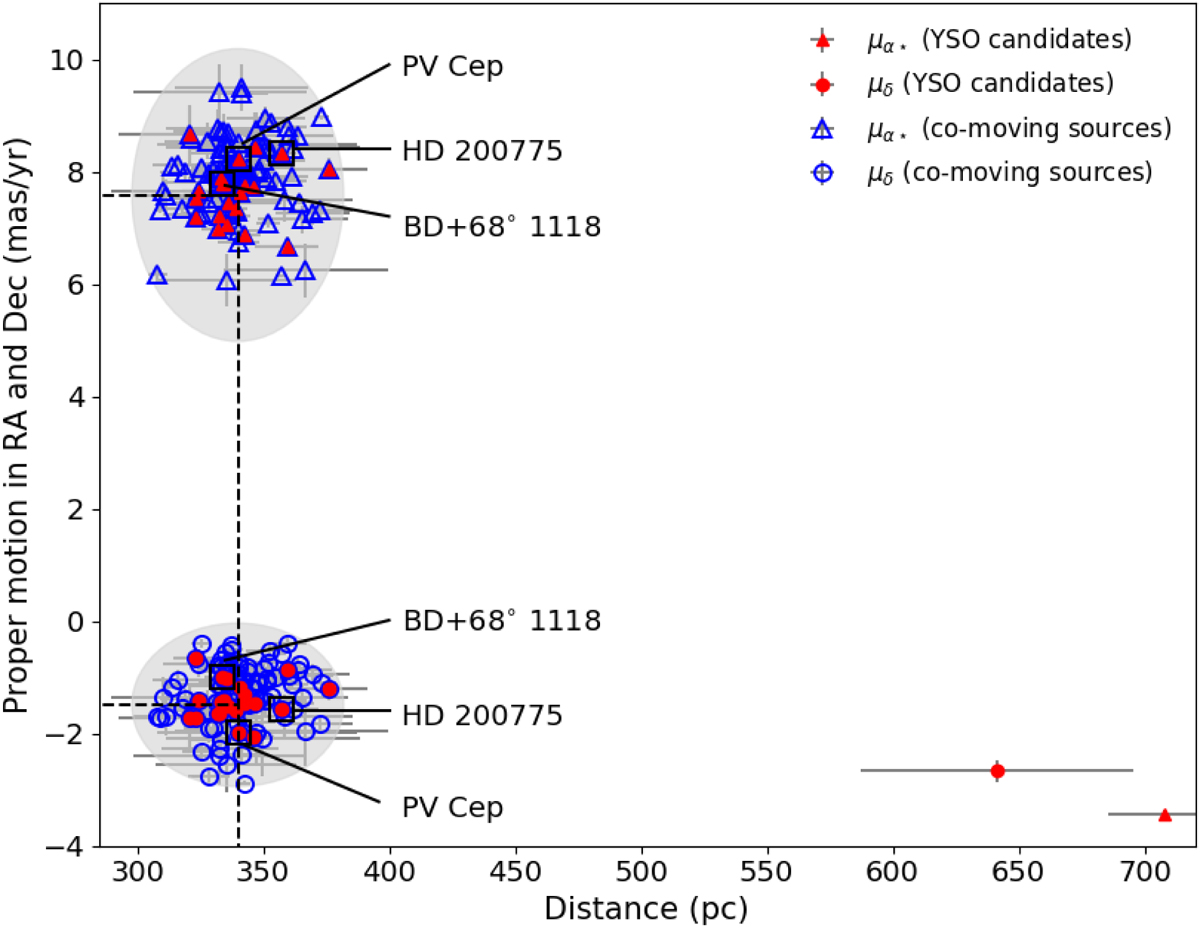
Fig. 3.
Download original image
Proper motion vs. distance plot for the known YSO candidates and the newly identified co-moving sources. The filled triangles and circles in red represent the d − μα⋆ and d − μδ values, respectively, of the known YSO candidates in L1147/1158, L1172/1174, and L1177. The open blue triangles and circles are the d − μα⋆ and d − μδ values of the co-moving sources, respectively. The locations of HD 200775, BD+68°1118, and PV Cep are identified by square boxes. The gray ellipses represent the boundaries of the proper motion values and the distance ranges used to identify the new co-moving sources. The dashed lines show the median values of d, μα⋆, and μδ.
Current usage metrics show cumulative count of Article Views (full-text article views including HTML views, PDF and ePub downloads, according to the available data) and Abstracts Views on Vision4Press platform.
Data correspond to usage on the plateform after 2015. The current usage metrics is available 48-96 hours after online publication and is updated daily on week days.
Initial download of the metrics may take a while.