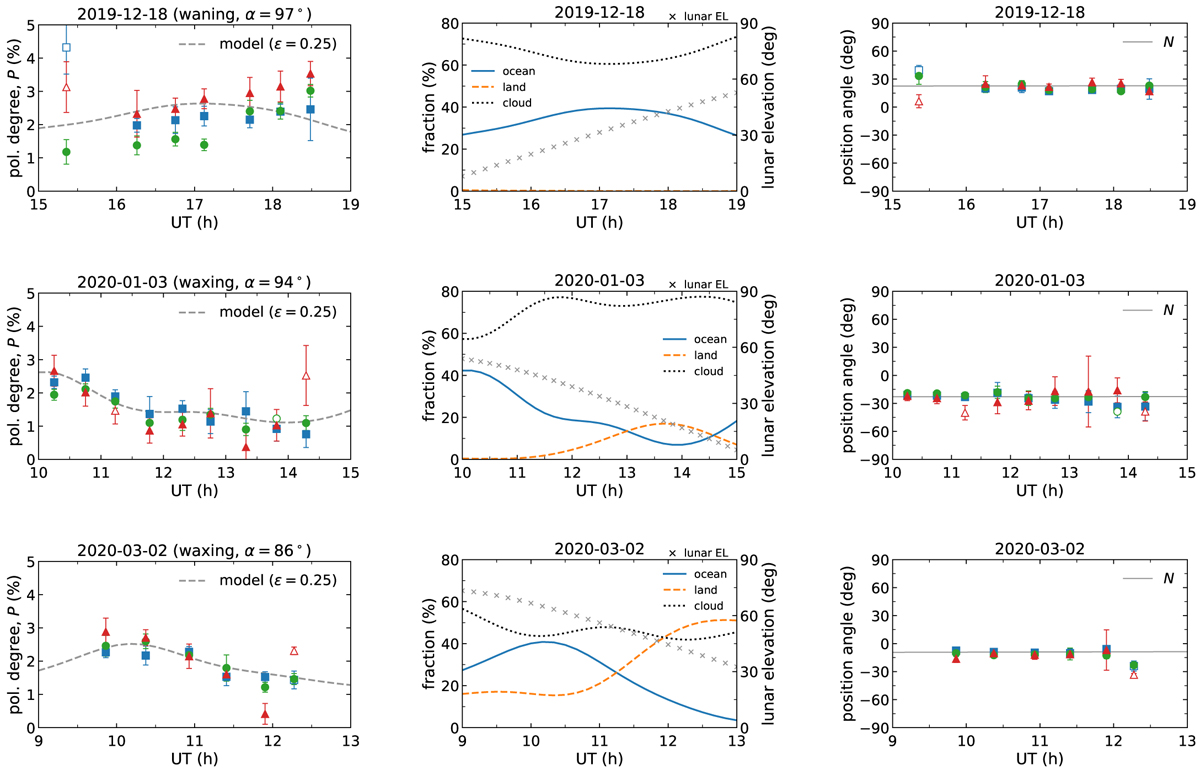
Fig. 8
Download original image
Time-series polarization degrees (left column), scene fractions (middle column), and polarization position angles (right column) for dates when significant hourly variation of polarization degree is detected. Left: Polarization degrees: Squares, circles, and triangles represent data in the J, H, and Ks bands, respectively. Open plots represent data points with |Θ − N| > 15°. The dashed line is the model curve for Earthshine polarization calculated based on the ocean, land, and cloud fractions. The applied lunar polarization efficiency (depolarizing factor, ϵ) is shown in the inset. Middle: Scene fractions: Ocean, land, and cloud fractions are exhibited as solid, dashed, and dotted lines, respectively (left y-axes). Fractions were calculated with concentrated weighting (see Appendix B.5). The crosses correspond to lunar elevation (right y-axes). Right: Polarization position angles: Solid lines in the right panels show the position angle normal to the scattering plane.
Current usage metrics show cumulative count of Article Views (full-text article views including HTML views, PDF and ePub downloads, according to the available data) and Abstracts Views on Vision4Press platform.
Data correspond to usage on the plateform after 2015. The current usage metrics is available 48-96 hours after online publication and is updated daily on week days.
Initial download of the metrics may take a while.