Free Access
Fig. 7
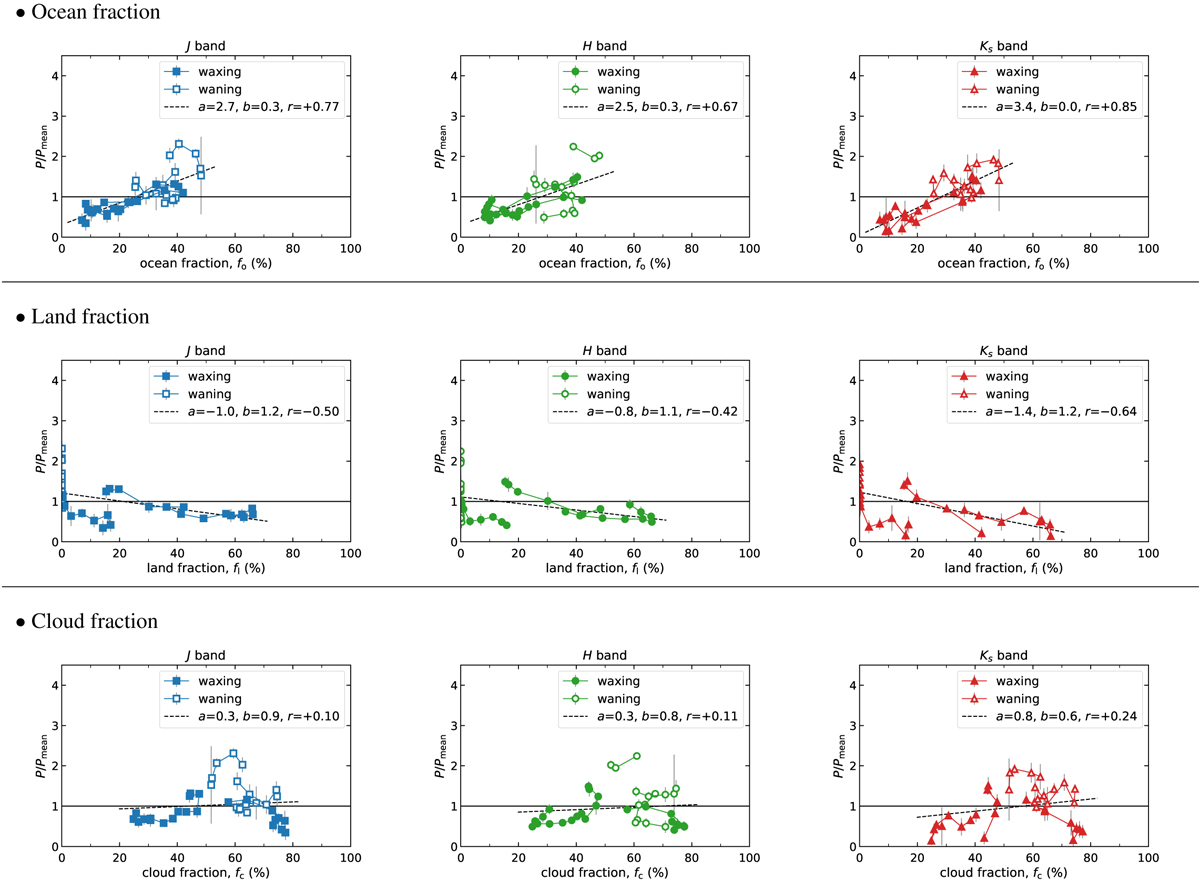
Download original image
Same figure as Fig. 5, except the data source is the time-resolved data on 2019 November 21, 2019 December 18, 2019 December 19, 2020 January 3, 2020 March 2, and 2020 April 29. The data on the same date are connected by lines.
Current usage metrics show cumulative count of Article Views (full-text article views including HTML views, PDF and ePub downloads, according to the available data) and Abstracts Views on Vision4Press platform.
Data correspond to usage on the plateform after 2015. The current usage metrics is available 48-96 hours after online publication and is updated daily on week days.
Initial download of the metrics may take a while.