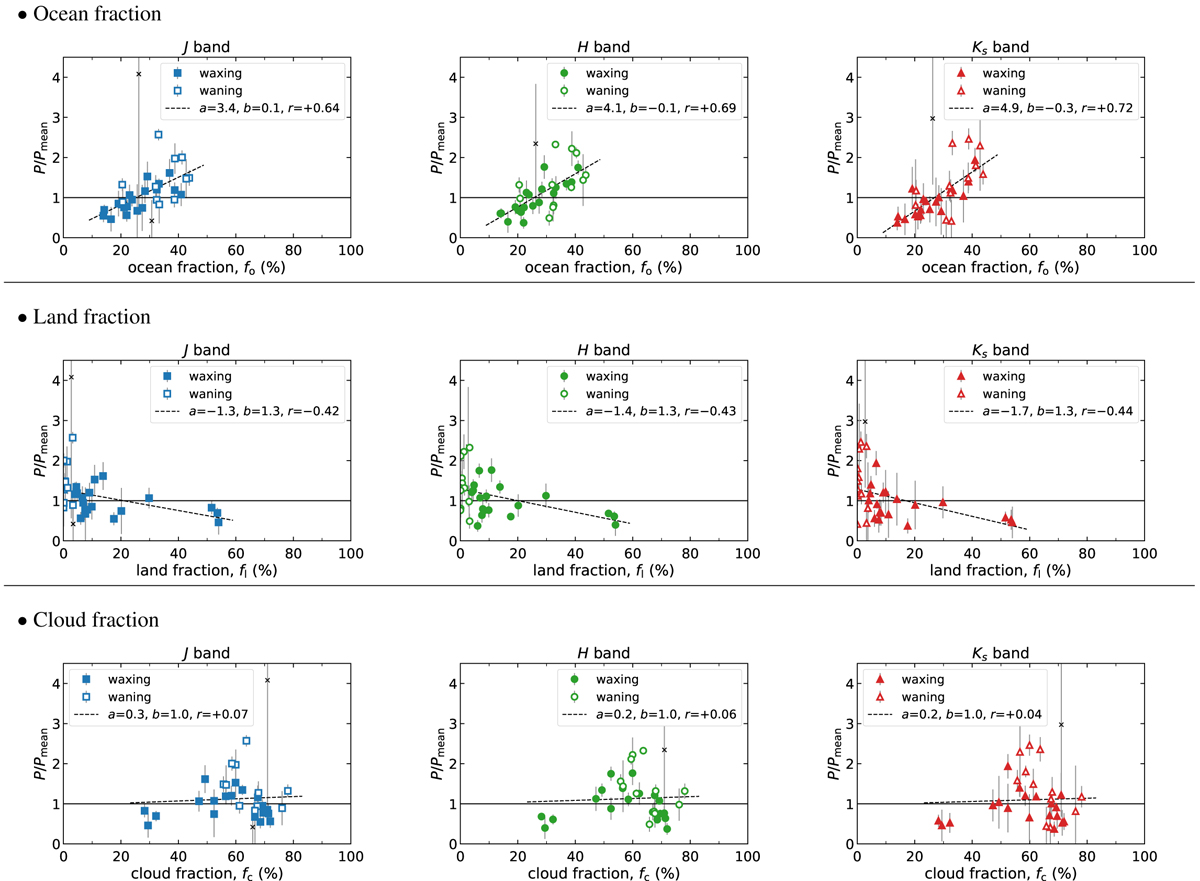
Fig. 5
Download original image
Dependence of polarization degree on ocean (top), land (middle), and cloud (bottom) fractions (in J, H, and Ks bands from left to right). Each polarization degree (P) in Fig. 4 is divided by typical polarization (Pmean: dashed line in Fig. 4) at the phase angle, and then plotted against the ocean, land, or cloud fraction (fo, fl, or fc, respectively). The filled and open plots correspond to observations in the waxing and waning phases, respectively. The dashed lines are regression lines of the form af + b with a correlation coefficient r. The crosses correspond to those in Fig. 4 and were excluded from the linear regression. The fractions was calculated with concentrated weighting.
Current usage metrics show cumulative count of Article Views (full-text article views including HTML views, PDF and ePub downloads, according to the available data) and Abstracts Views on Vision4Press platform.
Data correspond to usage on the plateform after 2015. The current usage metrics is available 48-96 hours after online publication and is updated daily on week days.
Initial download of the metrics may take a while.