Fig. 4
Download original image
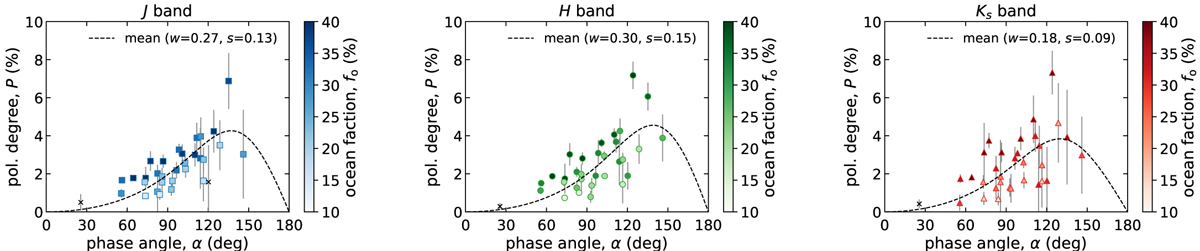
Earthshine polarization degrees (P) in J (left), H (middle), and Ks (right) bands, plotted against Sun–Earth–Moon phase angle (α). The ocean fraction was calculated with concentrated weighting (see Appendix B.5 for details on the derivation of the fractions). The dashed lines represent the polarization phase curve for the typical Earth scene. They are derived from fitting a curved line to all data points (with some exceptions described below) with free parameters w (single scattering albedo) and s (scaling factor). The crosses represent data points corresponding to |Θ − N| > 15° (where Θ denotes the position angle of polarization and N denotes the position angle normal to the scattering plane) or α < 50°, which were excluded from the fitting (see Appendix B.4 for details on the fitting). These figures give an impression that P for a larger ocean fraction (plots with a darker color) tends to be larger than those for a smaller ocean fraction at a similar α, which suggests that the contribution from the sea glint (specular reflection) enhances the polarization degree of Earth.
Current usage metrics show cumulative count of Article Views (full-text article views including HTML views, PDF and ePub downloads, according to the available data) and Abstracts Views on Vision4Press platform.
Data correspond to usage on the plateform after 2015. The current usage metrics is available 48-96 hours after online publication and is updated daily on week days.
Initial download of the metrics may take a while.