Free Access
Fig. 2
Download original image
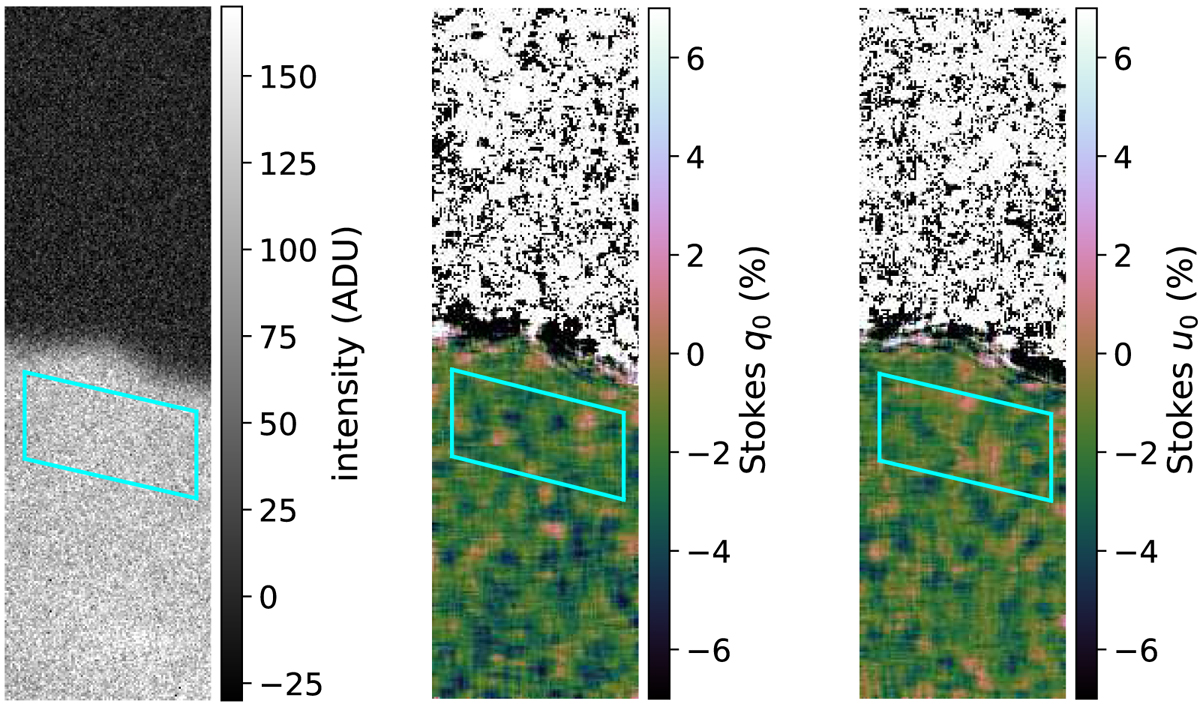
Intensity (left), Stokes q0 (middle), and u0 (right) images observed on 2020 January 3. North is right, and east is up. The FOV is ~ 19″ × 64″ (smaller than original FOV because of trimming). The parallelograms are the sampling regions. The values of q0 and u0 on the sky are scattered because of division of ~0 by ~ 0.
Current usage metrics show cumulative count of Article Views (full-text article views including HTML views, PDF and ePub downloads, according to the available data) and Abstracts Views on Vision4Press platform.
Data correspond to usage on the plateform after 2015. The current usage metrics is available 48-96 hours after online publication and is updated daily on week days.
Initial download of the metrics may take a while.