Fig. B.1
Download original image
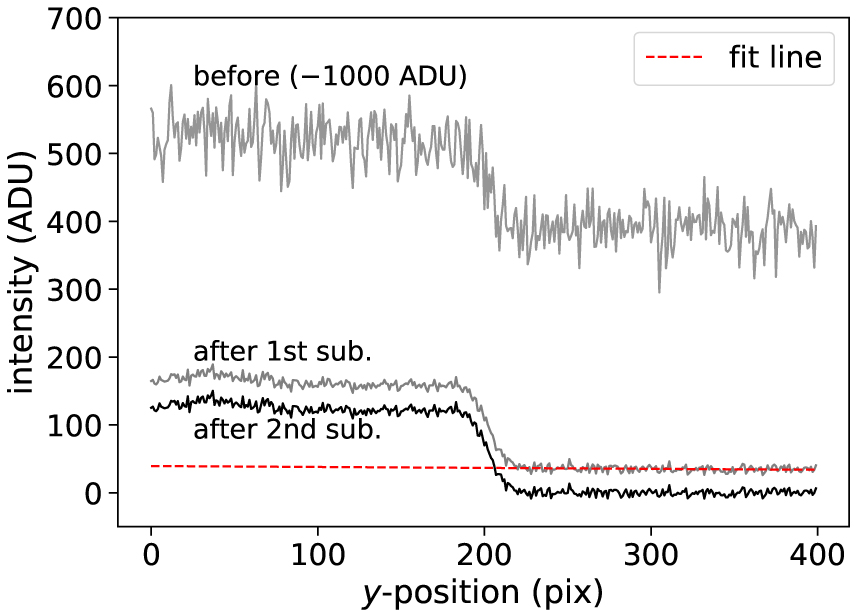
Intensity profiles before and after subtraction of sky background. The solid lines indicate profiles along the detector y-axis before the subtraction (top line), after the first subtraction (middle), and second subtraction (bottom). The top line is vertically offset by −1000 ADU for visibility. These profiles are averages of the central 20 x-positions. The left half area (y < ~ 200 pix) is the Moon (Earthshine), and the other half is sky. The dashed line is the fit line for the sky region. The corresponding image data after the second subtraction is shown in Fig. 2 (left).
Current usage metrics show cumulative count of Article Views (full-text article views including HTML views, PDF and ePub downloads, according to the available data) and Abstracts Views on Vision4Press platform.
Data correspond to usage on the plateform after 2015. The current usage metrics is available 48-96 hours after online publication and is updated daily on week days.
Initial download of the metrics may take a while.