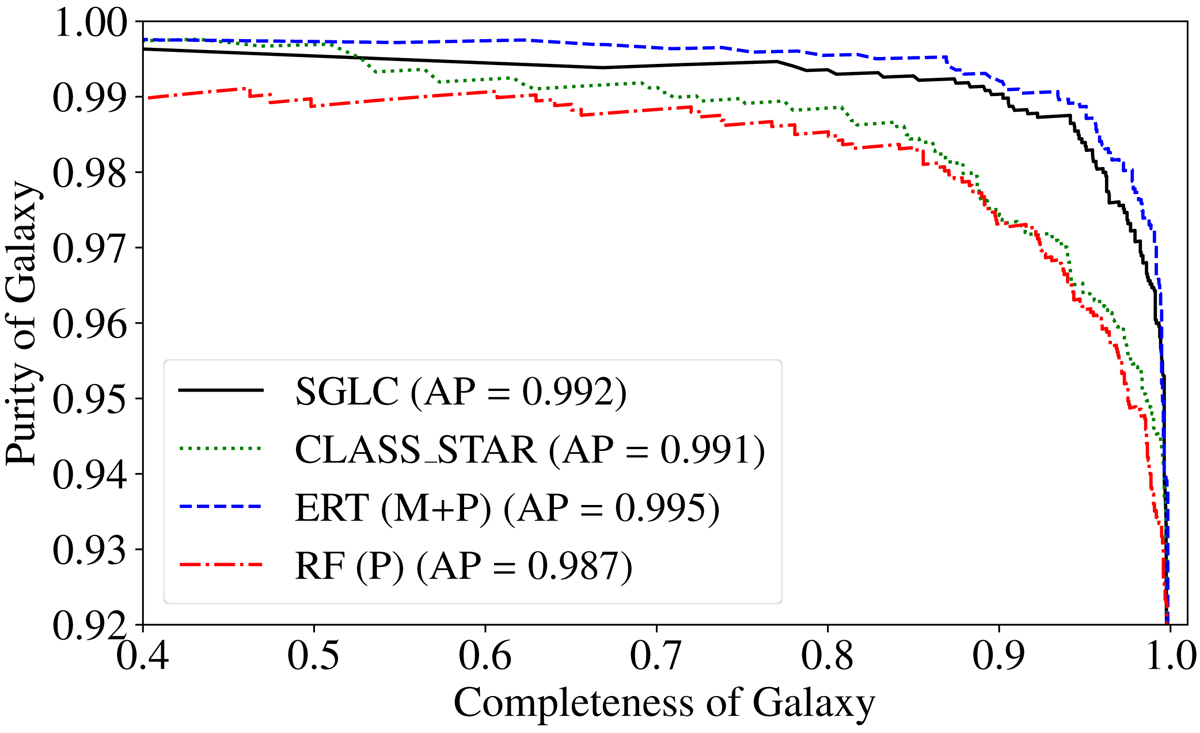
Fig. 8.
Download original image
Purity-completeness curves for galaxies in the magnitude range of 15 ≤ r ≤ 23.5, based on the morphological classification from SExtractor (CLASS_STAR, green dotted line), SGLC (black solid line), Extremely randomized trees (blue dashed line) and random forest (red dot-dashed line). ERT uses both the photometric (P) and morphological (M) information of the sources, while the RF uses photometric information only. AP is the area under the purity curve.
Current usage metrics show cumulative count of Article Views (full-text article views including HTML views, PDF and ePub downloads, according to the available data) and Abstracts Views on Vision4Press platform.
Data correspond to usage on the plateform after 2015. The current usage metrics is available 48-96 hours after online publication and is updated daily on week days.
Initial download of the metrics may take a while.