Free Access
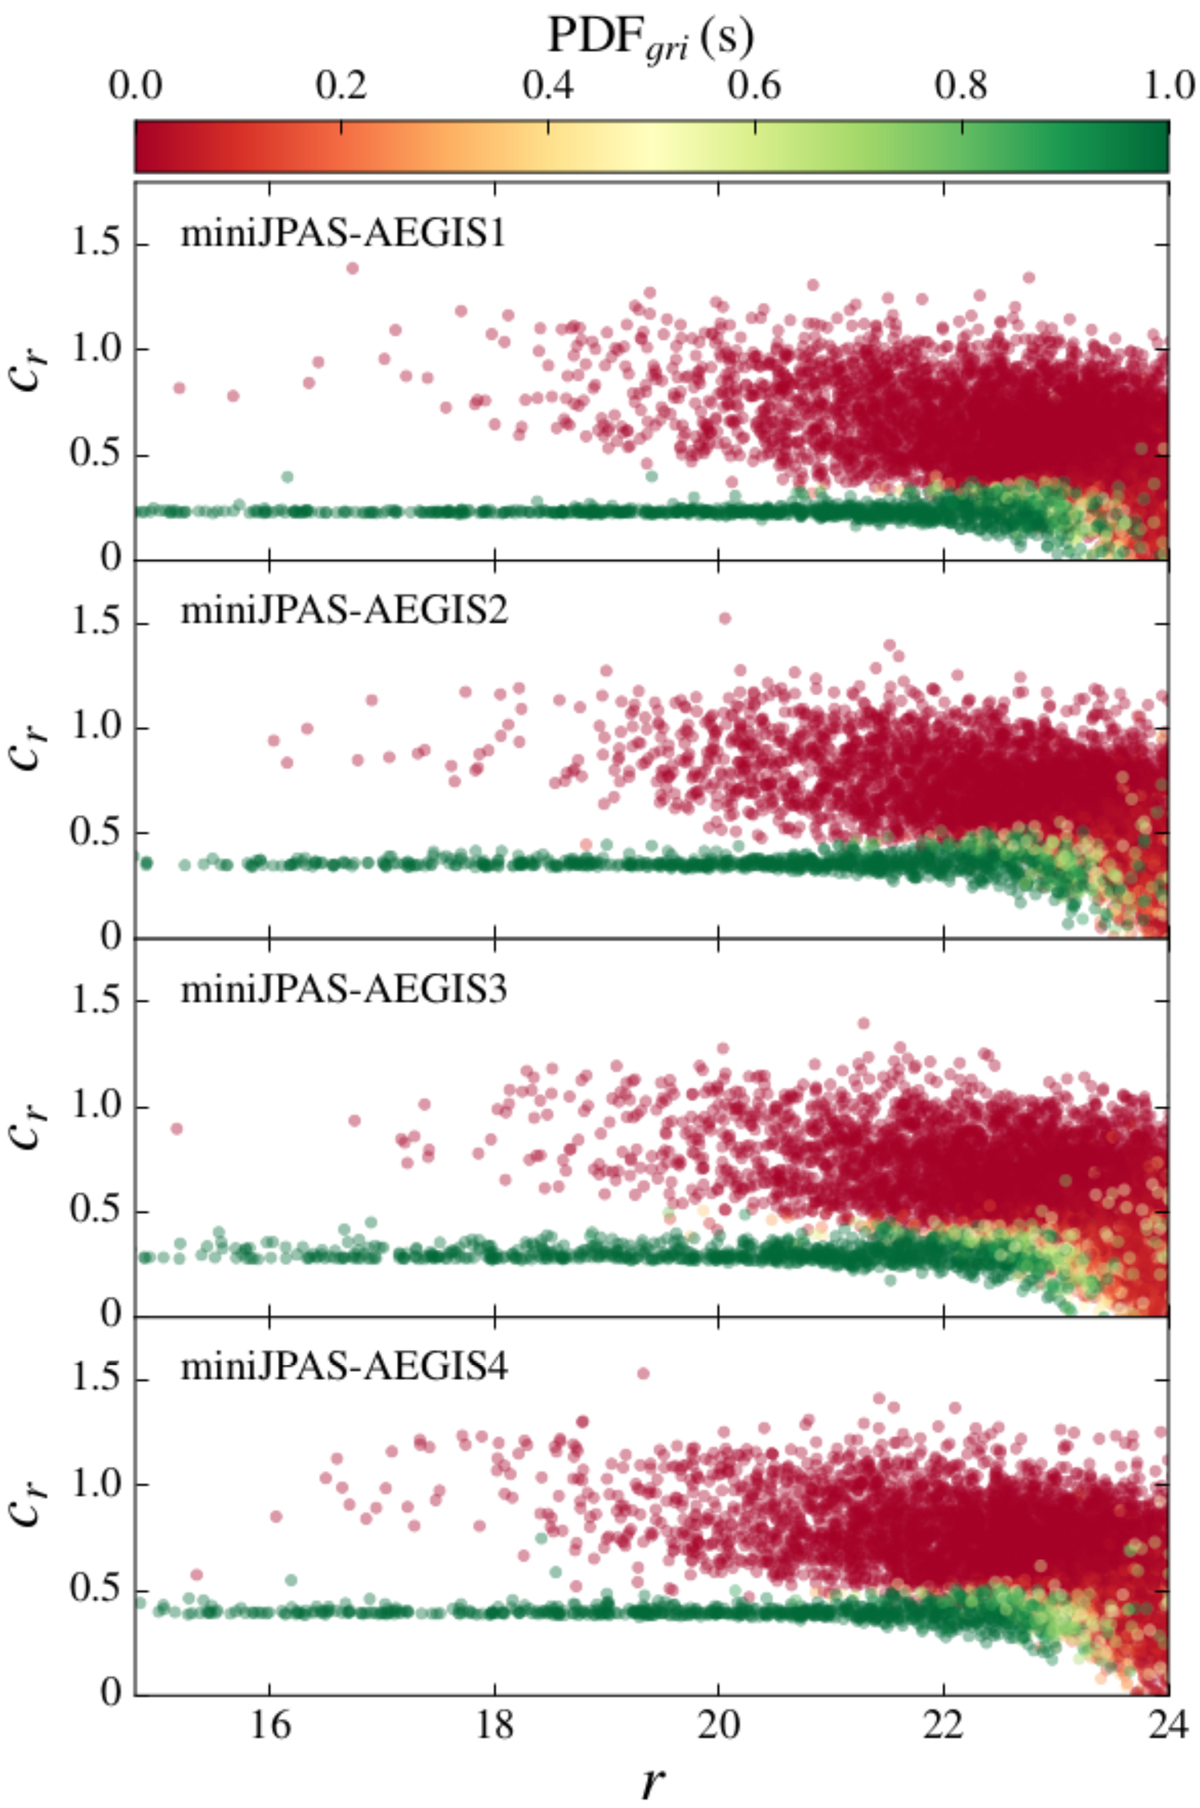
Fig. 7.
Download original image
Concentration–magnitude relation (MAG_AUTO) for sources in each individual miniJPAS pointing. Symbols are color-coded according to the probability of being compact or extended, based on the SGLC of López-Sanjuan et al. (2019b), adapted to the miniJPAS data.
Current usage metrics show cumulative count of Article Views (full-text article views including HTML views, PDF and ePub downloads, according to the available data) and Abstracts Views on Vision4Press platform.
Data correspond to usage on the plateform after 2015. The current usage metrics is available 48-96 hours after online publication and is updated daily on week days.
Initial download of the metrics may take a while.