Fig. 26.
Download original image
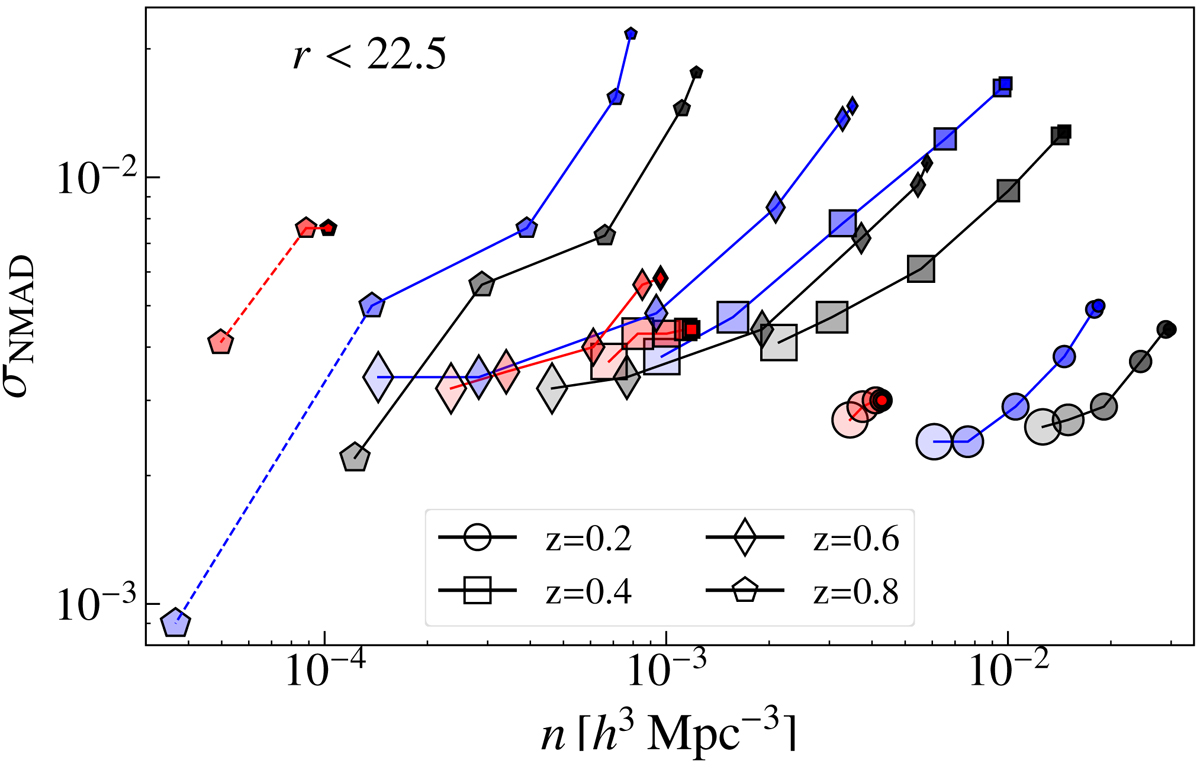
Relation between galaxy number density and corresponding redshift error, as a function of redshift, ODDS cut, and galaxy color. Red galaxies, blue galaxies and the full sample are shown in red, blue, and black lines and symbols, respectively. Results are presented in redshift bins of Δz = 0.2, centred at z = 0.2 (circles), z = 0.4 (squares), z = 0.6 (diamonds) and z = 0.8 (pentagons). For each redshift, the symbols correspond to the cumulative number density for increasing cuts, at ODDS > 0.0, 0.2, 0.4, 0.6, 0.8, 0.9 (for some cuts the symbols are overlapping). The larger the size of the symbols, the larger the ODDS cut (thus the redshift precision). Dashed lines correspond to the regime where we have, in the miniJPAS field, less than 15 galaxies.
Current usage metrics show cumulative count of Article Views (full-text article views including HTML views, PDF and ePub downloads, according to the available data) and Abstracts Views on Vision4Press platform.
Data correspond to usage on the plateform after 2015. The current usage metrics is available 48-96 hours after online publication and is updated daily on week days.
Initial download of the metrics may take a while.