Fig. 24.
Download original image
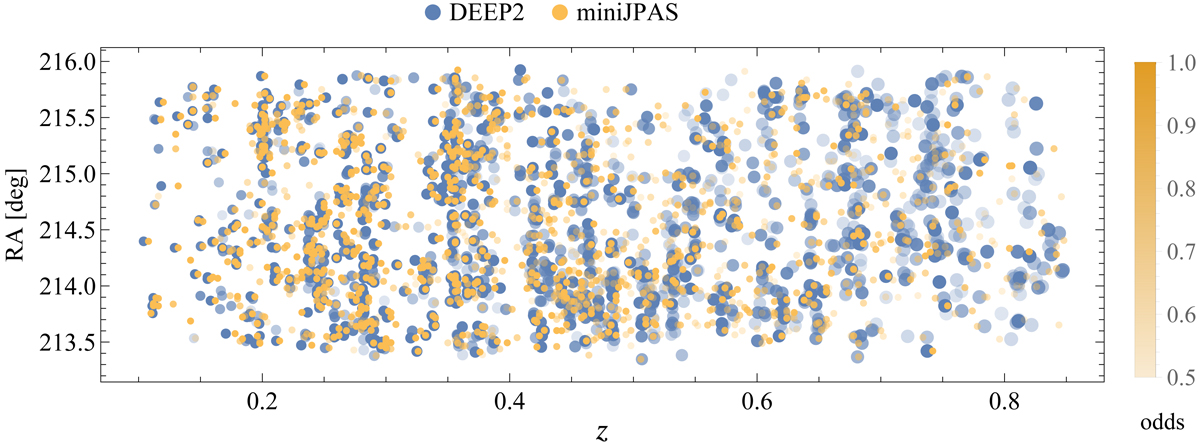
Slice of miniJPAS as mapped by the spectroscopic sample of DEEP2 (blue symbols) and the miniJPAS counterparts (orange symbols), for r < 22.5. miniJPAS successfully reproduces the pattern of spatial clustering of galaxies unveiled by the spectroscopic DEEP2 survey. The redshifts of miniJPAS sources are given by the best photo-z solution, as described in Sect. 4.2.2. The color shade of the miniJPAS/DEEP2 galaxy pairs is related to the ODDS value of the miniJPAS photo-z solution. The size of the symbols of DEEP2 sources is given by the target photo-z precision, σNMAD = 0.003 × (1 + z), which is reached when the constant-size miniJPAS symbol lies within the DEEP2 one.
Current usage metrics show cumulative count of Article Views (full-text article views including HTML views, PDF and ePub downloads, according to the available data) and Abstracts Views on Vision4Press platform.
Data correspond to usage on the plateform after 2015. The current usage metrics is available 48-96 hours after online publication and is updated daily on week days.
Initial download of the metrics may take a while.