Fig. 23.
Download original image
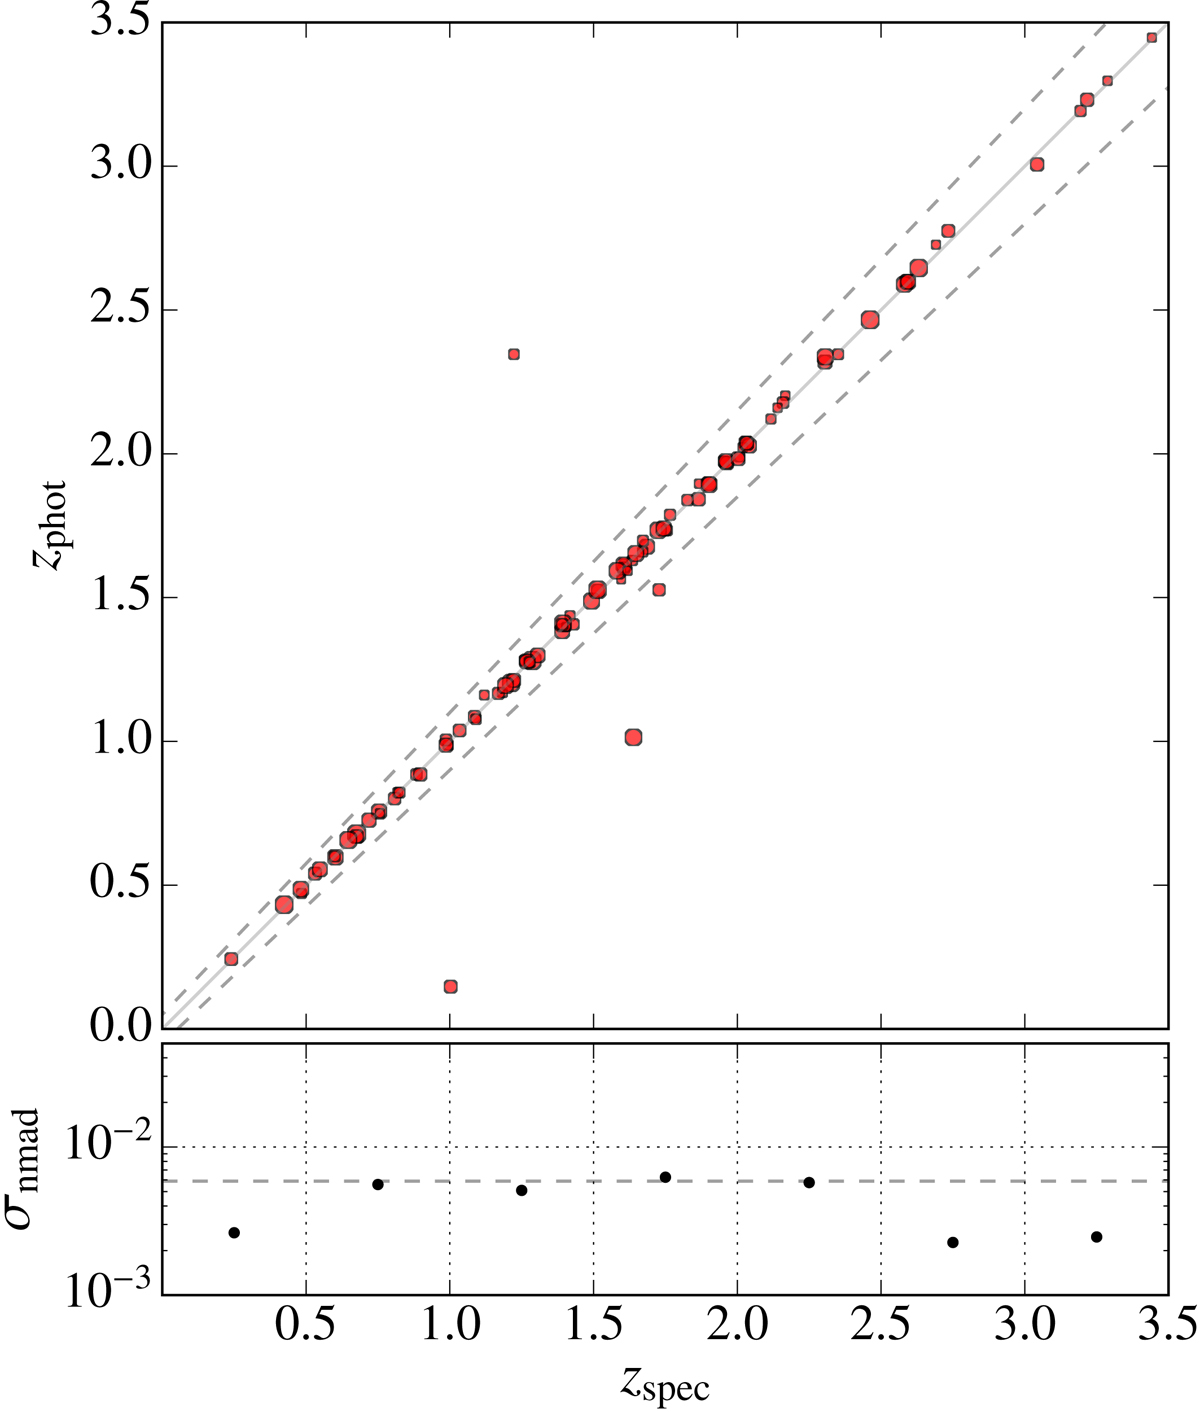
Photo-z of miniJPAS quasars. Upper panel: photometric versus spectroscopic redshifts for a sample of 97 DR14 quasars with zspec < 3.5 detected in the miniJPAS field. Larger symbols represent higher med(S/N). The solid diagonal line indicates zphot = zspec, and the dashed lines correspond to zphot = zspec ± 0.05(1 + zspec). The average photo-z uncertainty, σnmad, is 0.0059 and the fraction of outliers is 4.1%. Bottom panel: photo-z precision as a function of redshift, with the horizontal dashed gray line indicating the average photo-z uncertainty.
Current usage metrics show cumulative count of Article Views (full-text article views including HTML views, PDF and ePub downloads, according to the available data) and Abstracts Views on Vision4Press platform.
Data correspond to usage on the plateform after 2015. The current usage metrics is available 48-96 hours after online publication and is updated daily on week days.
Initial download of the metrics may take a while.