Fig. 22.
Download original image
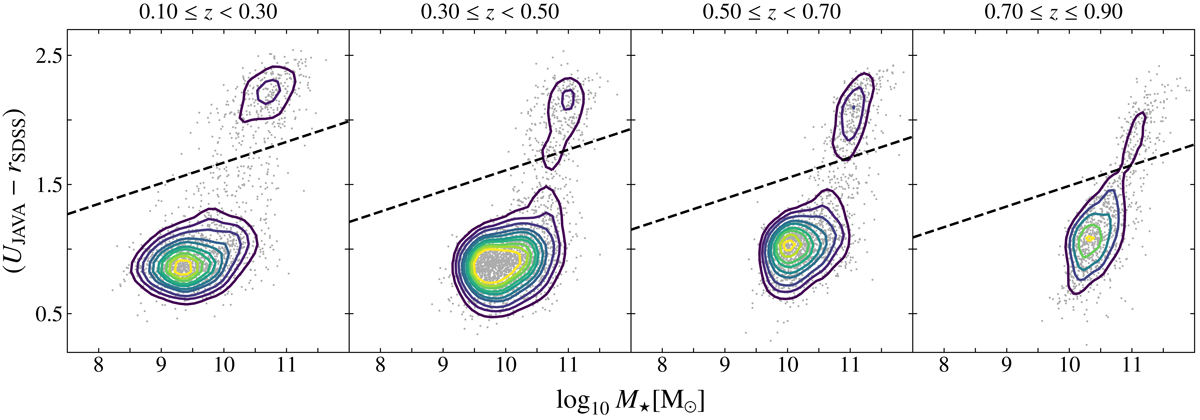
Rest-frame stellar mass–color diagram corrected for extinction, showing the distribution of star-forming (lower cloud) and quiescent (upper cloud) galaxies at four redshift intervals. The dashed black line illustrates the lower color limit of quiescent galaxies as a function of stellar mass and redshift. Yellow (purple) contours illustrate higher (lower) densities.
Current usage metrics show cumulative count of Article Views (full-text article views including HTML views, PDF and ePub downloads, according to the available data) and Abstracts Views on Vision4Press platform.
Data correspond to usage on the plateform after 2015. The current usage metrics is available 48-96 hours after online publication and is updated daily on week days.
Initial download of the metrics may take a while.