Fig. 20.
Download original image
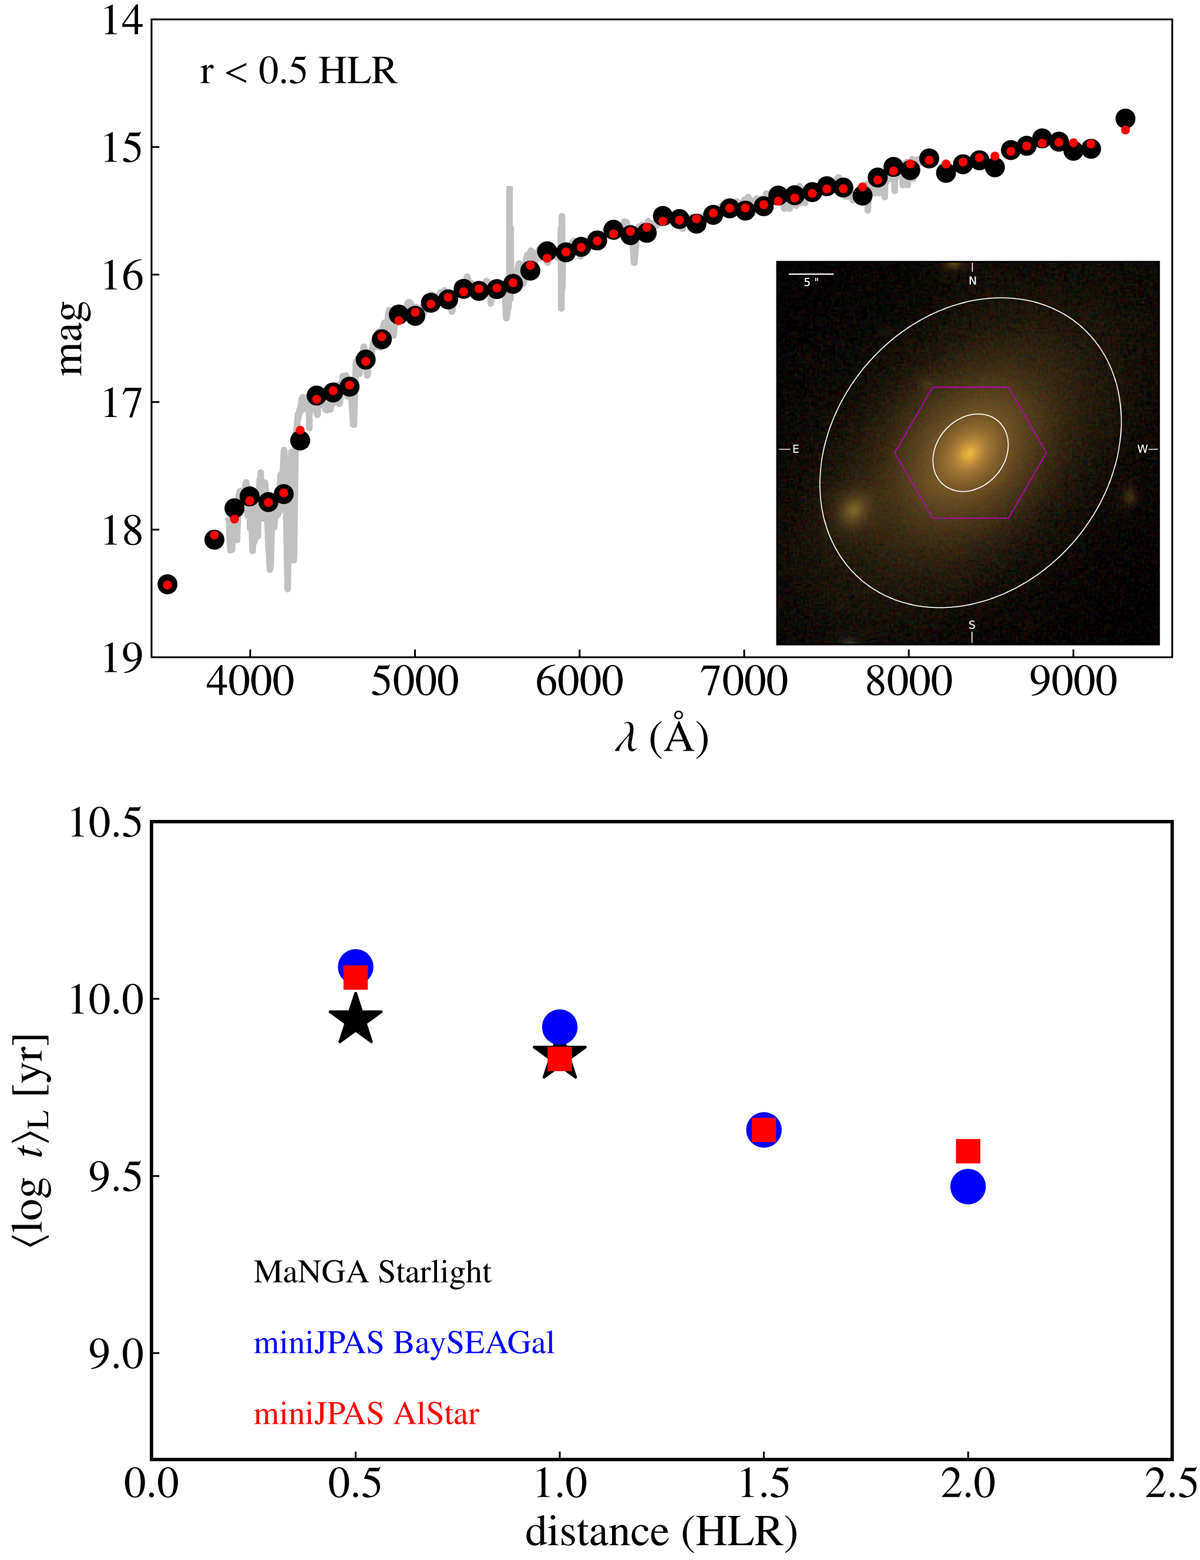
Spatially-resolved properties of a galaxy at z ∼ 0.1. Upper panel: MaNGA spectrum (grey line) of the central annulus, up to 0.5 HLR, compared with miniJPAS data (black dots). The result of the fitting of miniJPAS data is also plotted (red dots). The inset shows an image of the galaxy in the r band where two ellipses are overlaid at 0.5 and 2 HLR. The FoV of the MaNGA survey is over-plotted as a red hexagon. Bottom panel: comparison of the radial variation of the average age ⟨log t⟩L derived from miniJPAS data, with the non-parametric code AlStar (red dots) and the parametric code BaySEAGal (blue dots), and from the MaNGA data analysed with the STARLIGHT code (black stars).
Current usage metrics show cumulative count of Article Views (full-text article views including HTML views, PDF and ePub downloads, according to the available data) and Abstracts Views on Vision4Press platform.
Data correspond to usage on the plateform after 2015. The current usage metrics is available 48-96 hours after online publication and is updated daily on week days.
Initial download of the metrics may take a while.