Fig. 18.
Download original image
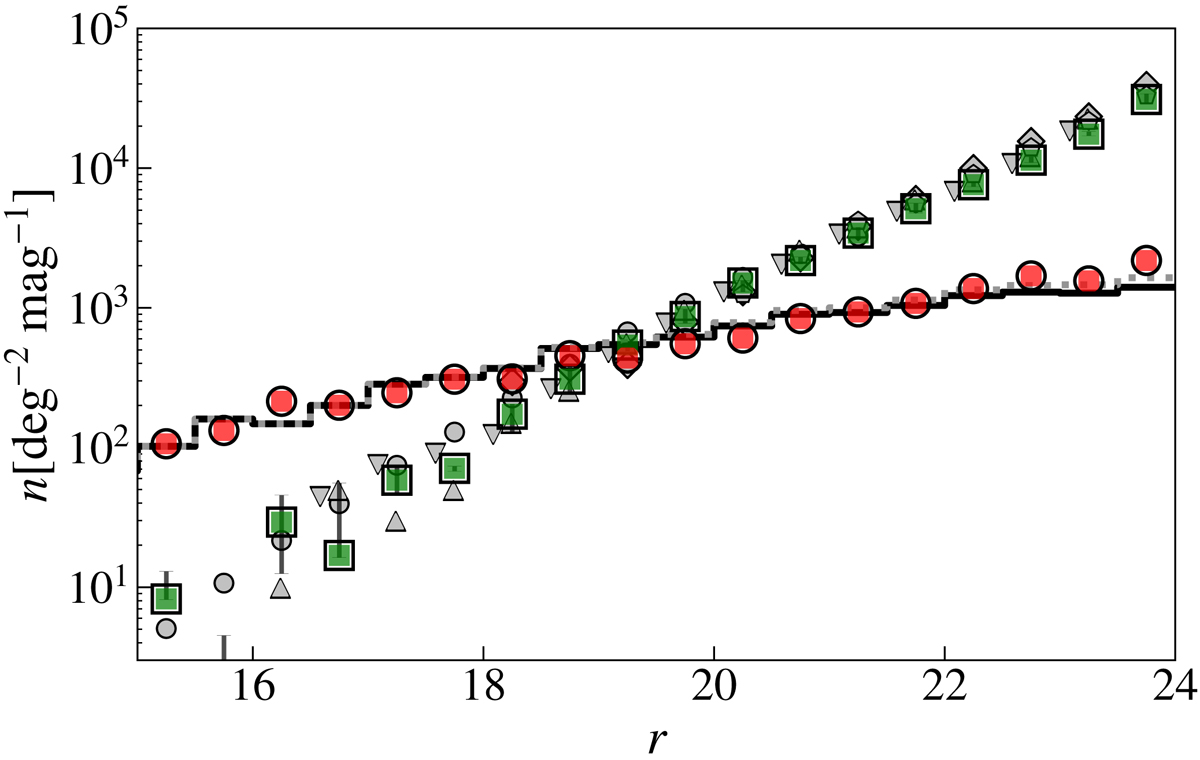
Stellar (red dots) and galaxy (green squares) number counts as a function of the r band magnitude. The black solid curve shows the stellar number counts at the EGS position estimated with the default TRILEGAL model of the Milky Way (Girardi et al. 2005). The dotted gray curve includes the expected contribution for point-like quasars (from the BOSS survey, Palanque-Delabrouille et al. 2016) to the compact population. Gray symbols are galaxy number counts from the literature: Yasuda et al. (2001, circles); Huang et al. (2001, triangles); Kümmel & Wagner (2001, inverted triangles); Kashikawa et al. (2004, diamonds); and Capak et al. (2004, pentagons).
Current usage metrics show cumulative count of Article Views (full-text article views including HTML views, PDF and ePub downloads, according to the available data) and Abstracts Views on Vision4Press platform.
Data correspond to usage on the plateform after 2015. The current usage metrics is available 48-96 hours after online publication and is updated daily on week days.
Initial download of the metrics may take a while.