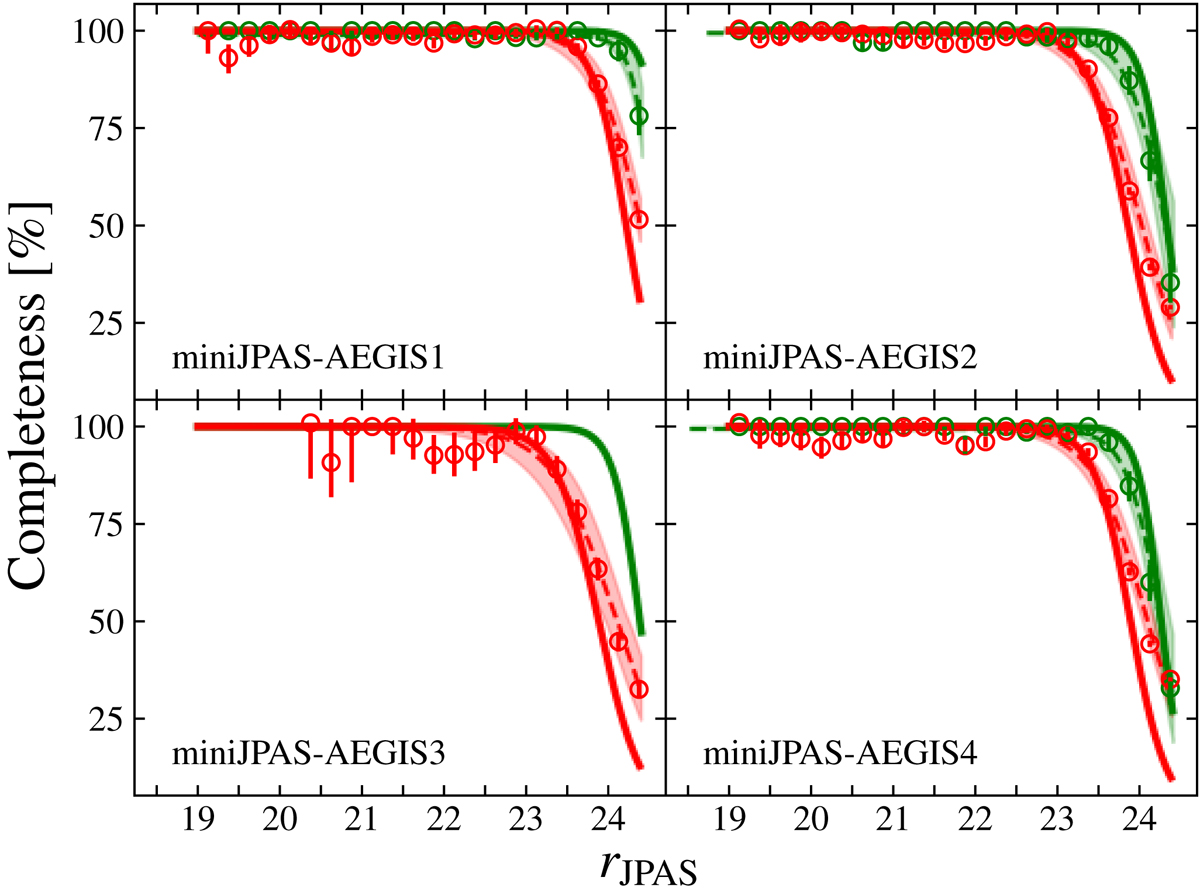
Fig. 16.
Download original image
Completeness of extended and point-like miniJPAS sources as a function of total magnitude in the miniJPAS r band for the four miniJPAS pointings. The solid lines are the completeness curves of extended and point-like sources (red and green, respectively) obtained from the injection and detection of synthetic sources. The red (green) circles illustrate the corrected fraction of common extended (point-like) sources in the miniJPAS and HSC-SSP surveys (this comparison is not possible for miniJPAS-AEGIS3, given the small area of overlap between this pointing and HSC-SSP). The dashed colored lines are the completeness curves obtained from the comparison with the HSC-SSP dataset, with uncertainties highlighted by the shaded area.
Current usage metrics show cumulative count of Article Views (full-text article views including HTML views, PDF and ePub downloads, according to the available data) and Abstracts Views on Vision4Press platform.
Data correspond to usage on the plateform after 2015. The current usage metrics is available 48-96 hours after online publication and is updated daily on week days.
Initial download of the metrics may take a while.