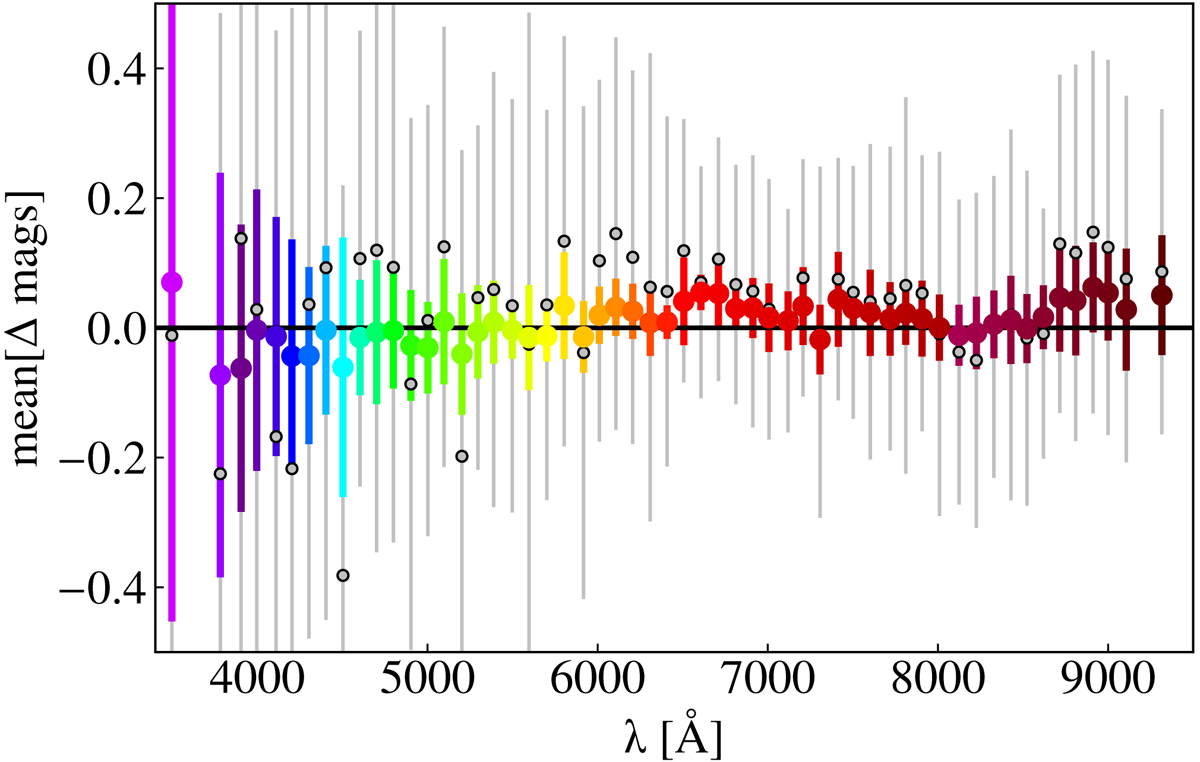
Fig. 15.
Download original image
Difference between miniJPAS photometry (MAG_PSFCOR magnitudes) and synthetic photometry derived by convolving SDSS spectra with the J-PAS filters. Coloured symbols, and thick error bars, correspond to galaxies with r < 20, while gray circles with thin error bars to galaxies with 20 < r < 22.5. The error bars refer to the scatter of the distribution within each filter.
Current usage metrics show cumulative count of Article Views (full-text article views including HTML views, PDF and ePub downloads, according to the available data) and Abstracts Views on Vision4Press platform.
Data correspond to usage on the plateform after 2015. The current usage metrics is available 48-96 hours after online publication and is updated daily on week days.
Initial download of the metrics may take a while.