Free Access
Fig. 14.
Download original image
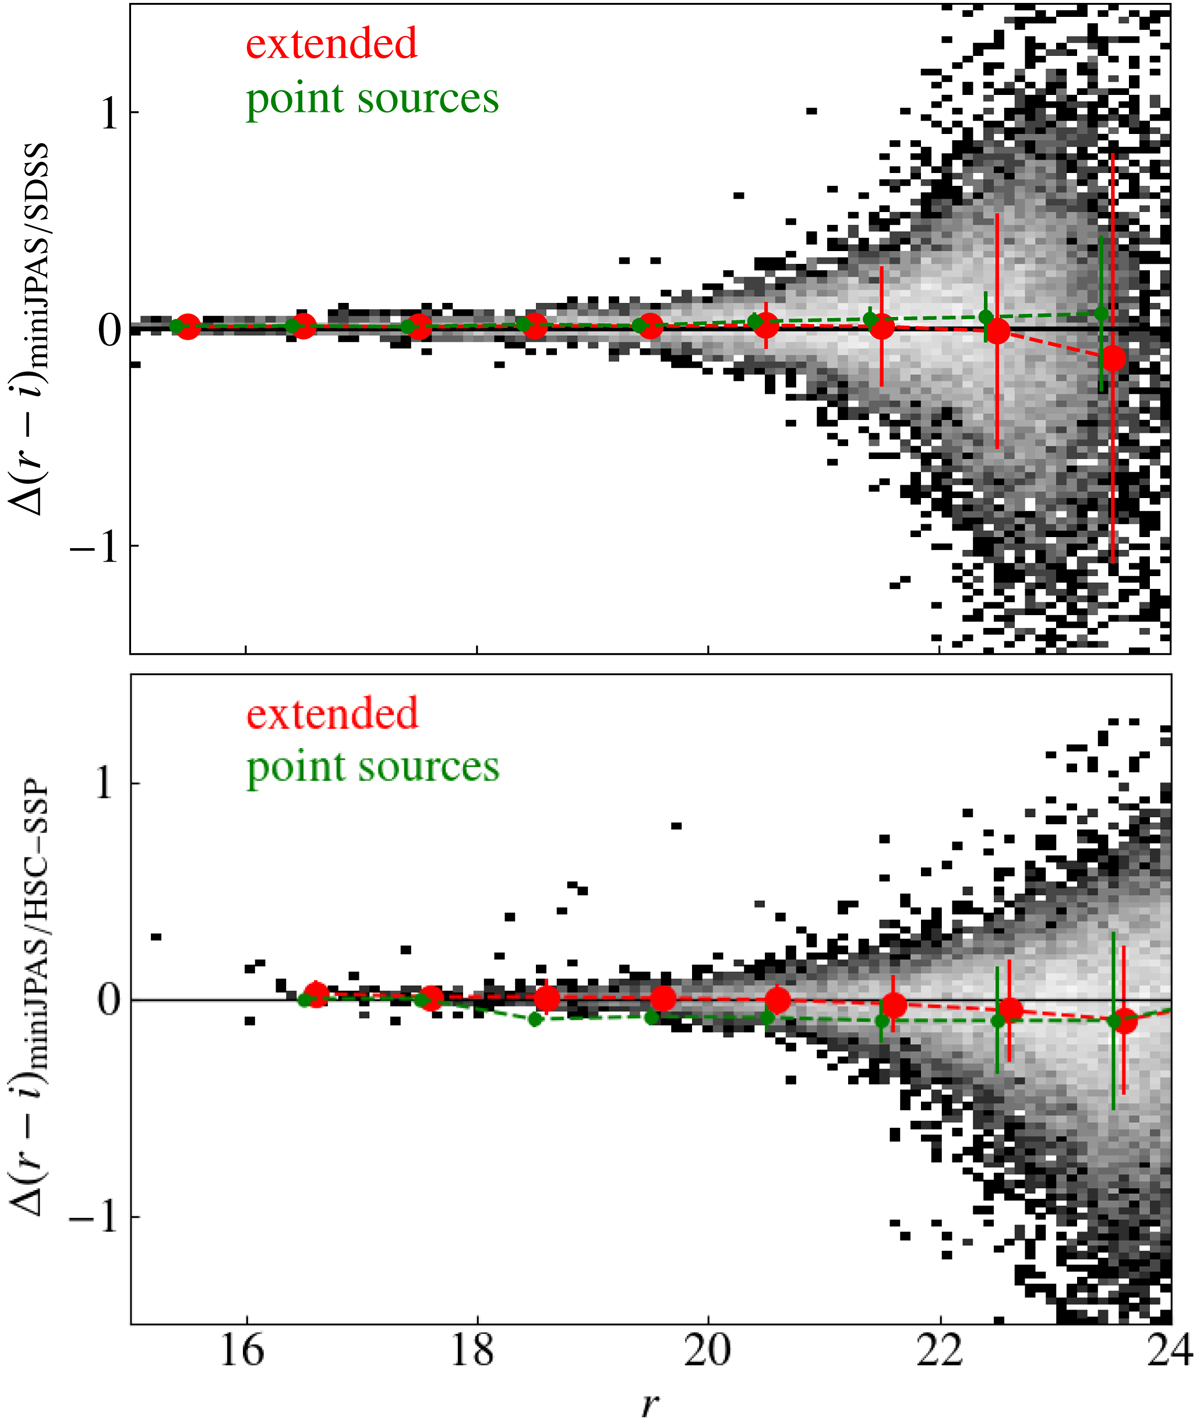
Color (r − i) difference of miniJPAS and SDSS (upper panel) and HSC-SSP (lower panel) as a function of the miniJPAS r band. The gray density map is for all objects. The colored points indicate the median with 1σ error in different magnitude bins for extended (red) and point sources (green).
Current usage metrics show cumulative count of Article Views (full-text article views including HTML views, PDF and ePub downloads, according to the available data) and Abstracts Views on Vision4Press platform.
Data correspond to usage on the plateform after 2015. The current usage metrics is available 48-96 hours after online publication and is updated daily on week days.
Initial download of the metrics may take a while.