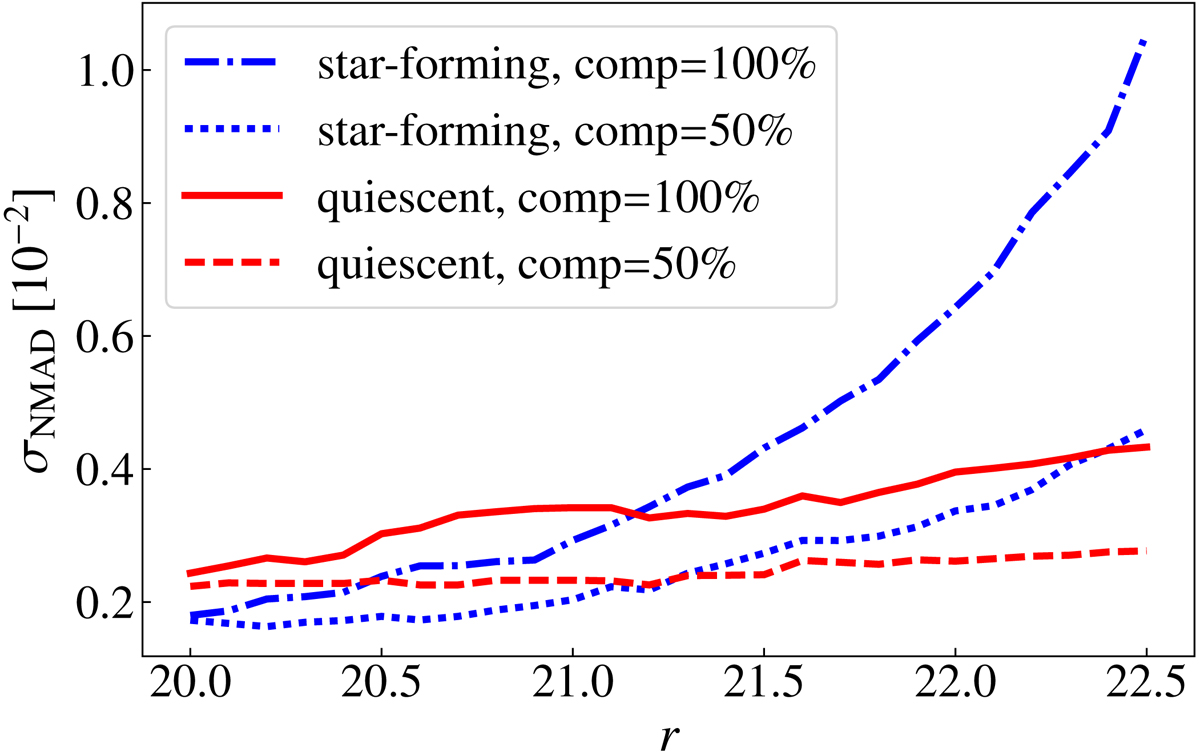
Fig. 12.
Download original image
Dependence of photo-z errors on the limiting magnitude in the r-band for galaxies in the “passive” subsample (red line) compared to other galaxies (main sequence and starburst galaxies, blue line). Solid lines indicate values for 100% completeness (no cut in ODDS), while dashed lines correspond to the 50% with highest ODDS in each magnitude bin.
Current usage metrics show cumulative count of Article Views (full-text article views including HTML views, PDF and ePub downloads, according to the available data) and Abstracts Views on Vision4Press platform.
Data correspond to usage on the plateform after 2015. The current usage metrics is available 48-96 hours after online publication and is updated daily on week days.
Initial download of the metrics may take a while.