Open Access
Fig. 9.
Download original image
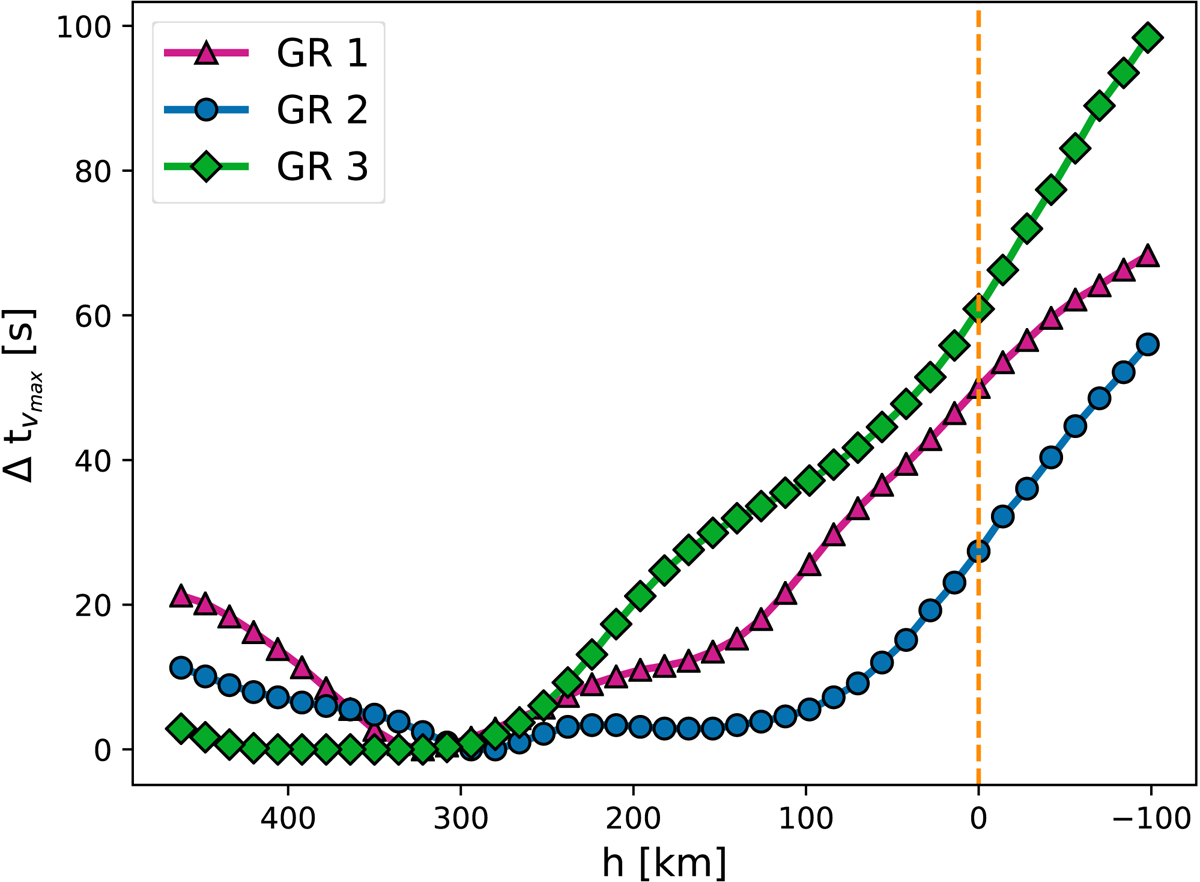
Time delay Δtvmax plotted over the height in the simulated solar atmosphere from 100 km below the photosphere to about 476 km above for different simulated granules. The dashed orange line indicates h = 0 km.
Current usage metrics show cumulative count of Article Views (full-text article views including HTML views, PDF and ePub downloads, according to the available data) and Abstracts Views on Vision4Press platform.
Data correspond to usage on the plateform after 2015. The current usage metrics is available 48-96 hours after online publication and is updated daily on week days.
Initial download of the metrics may take a while.