Fig. 8.
Download original image
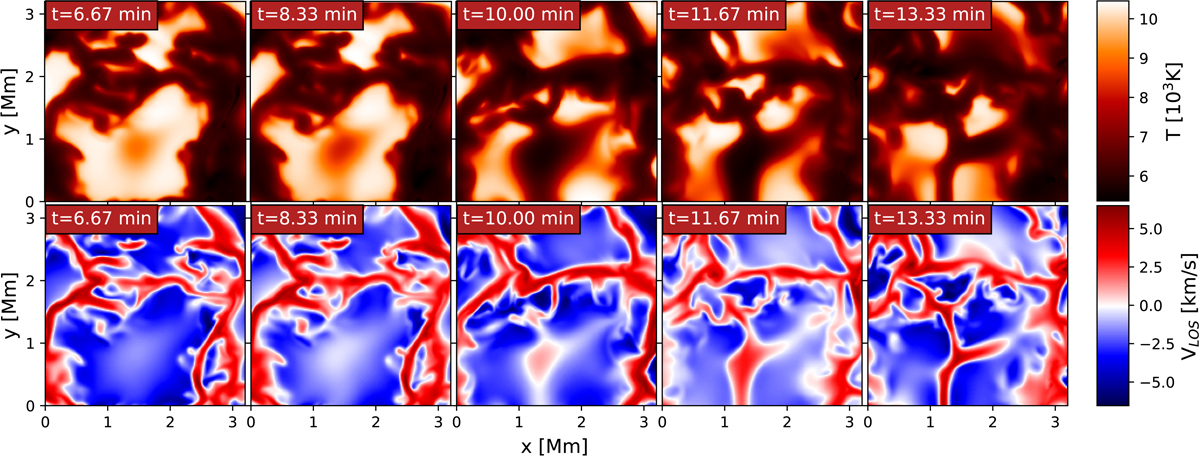
Time evolution of an exploding granule obtained with simulations of the MANCHA3D code. The first row shows the temperature at height 0 km, and the second row shows the corresponding vertical component of the velocity. The times mentioned here are the relative times of the simulation with t = 0 min as the starting point of our extracted time series.
Current usage metrics show cumulative count of Article Views (full-text article views including HTML views, PDF and ePub downloads, according to the available data) and Abstracts Views on Vision4Press platform.
Data correspond to usage on the plateform after 2015. The current usage metrics is available 48-96 hours after online publication and is updated daily on week days.
Initial download of the metrics may take a while.