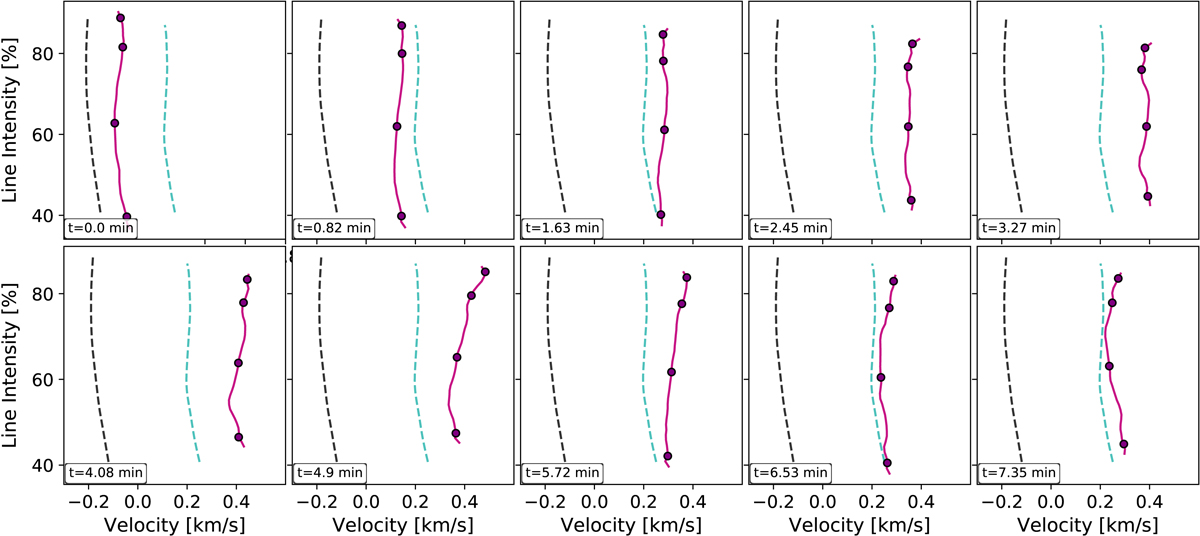
Fig. 6.
Download original image
Time evolution of a bisector (pink solid line) measured in the dark core of exploding granule IBIS 2. Black dots correspond to the bisectors measured at the spectral locations closest to the observations. The dashed black lines denote the mean bisector of regular granules, and the dashed turquoise line the mean bisector of the regular intergranules. Time evolves from left to right and continues in the second row.
Current usage metrics show cumulative count of Article Views (full-text article views including HTML views, PDF and ePub downloads, according to the available data) and Abstracts Views on Vision4Press platform.
Data correspond to usage on the plateform after 2015. The current usage metrics is available 48-96 hours after online publication and is updated daily on week days.
Initial download of the metrics may take a while.