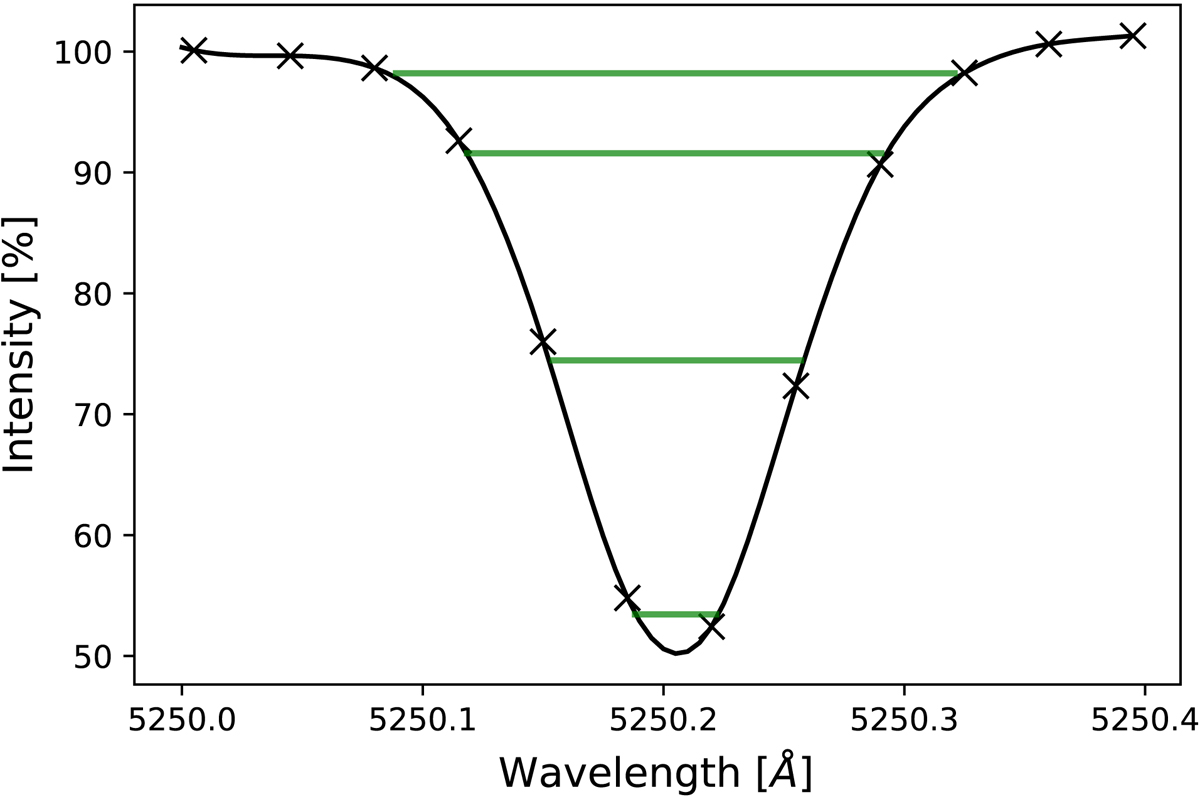
Fig. 2.
Download original image
Line profile of the 5250.2 Å line (IMaX data), where 100% of intensity is designated as an average of the continuum. The markers denote the averaged observed line profile, and the solid line corresponds to a cubic spline interpolated profile. The horizontal green lines mark the used bisector heights that are closest to the observed wavelength points.
Current usage metrics show cumulative count of Article Views (full-text article views including HTML views, PDF and ePub downloads, according to the available data) and Abstracts Views on Vision4Press platform.
Data correspond to usage on the plateform after 2015. The current usage metrics is available 48-96 hours after online publication and is updated daily on week days.
Initial download of the metrics may take a while.