Fig. A.2.
Download original image
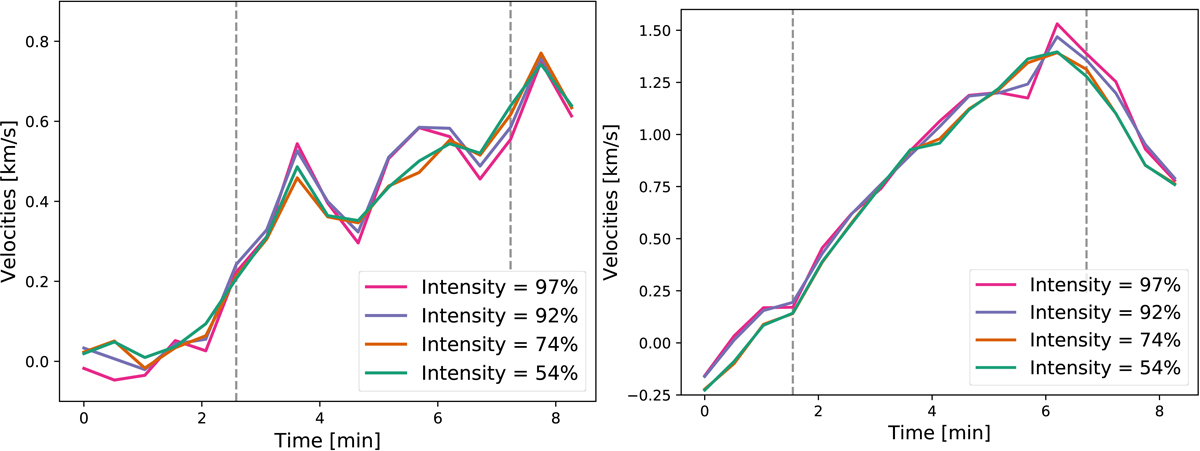
Same as in Fig. A.1, now for IMaX data. The left plot shows the velocities of granule IMaX 1, and the right plot shows results from granule IMaX 2. The left dashed line marks the time at which the dark core is visible for the first time, and the right dashed line marks the time at which the exploding granule is split into a new generation of granules.
Current usage metrics show cumulative count of Article Views (full-text article views including HTML views, PDF and ePub downloads, according to the available data) and Abstracts Views on Vision4Press platform.
Data correspond to usage on the plateform after 2015. The current usage metrics is available 48-96 hours after online publication and is updated daily on week days.
Initial download of the metrics may take a while.