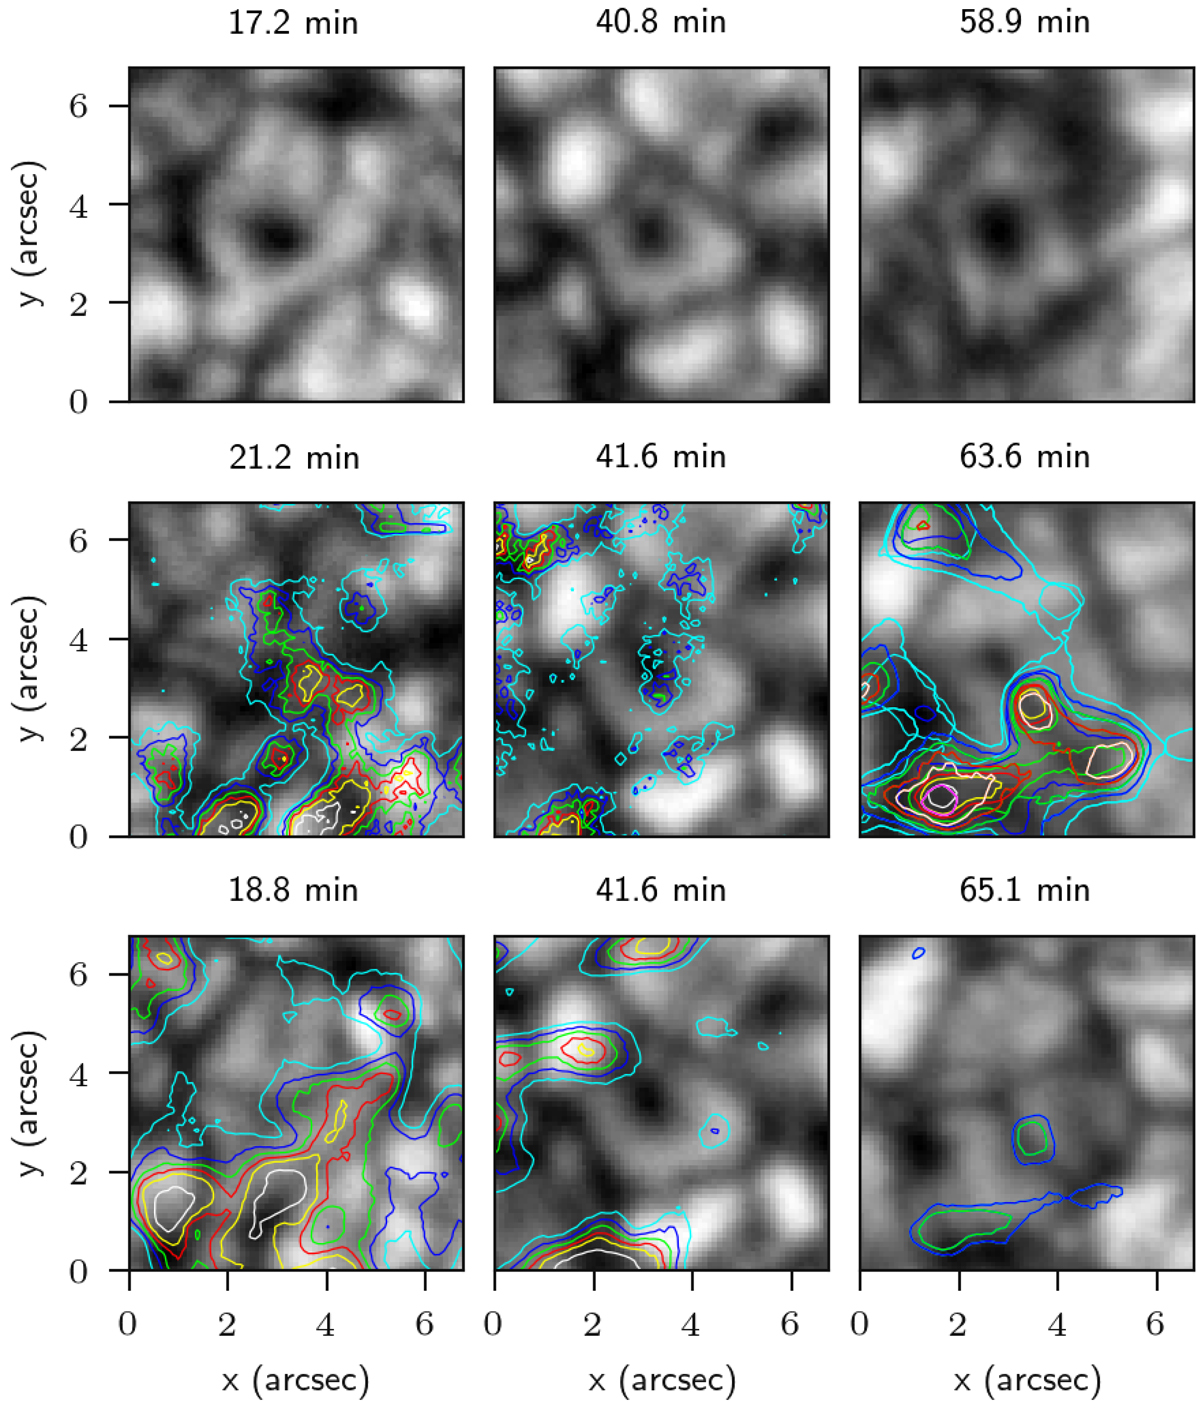
Fig. 12.
Download original image
Top row: continuum images of three different exploding granules during the formation of the dark core recorded with the IBIS instrument. Second row: image in the background again shows the continuum image. Areas with a wavelet power for normalised line-core intensity oscillations in the Ca II 8542 Å (first two exploding granules) and Na I 5896 Å (last granule) lines are marked by contours, with the averaged power in the period range of 120 s to 190 s. Colours correspond to different percentages of the maximum power in the field of view (cyan 20%, blue 30%, green 40%, red 50%, yellow 60%, white 80%, and fuchsia 100%). Lower row: line-of-sight velocity oscillation power in the same format as the second row.
Current usage metrics show cumulative count of Article Views (full-text article views including HTML views, PDF and ePub downloads, according to the available data) and Abstracts Views on Vision4Press platform.
Data correspond to usage on the plateform after 2015. The current usage metrics is available 48-96 hours after online publication and is updated daily on week days.
Initial download of the metrics may take a while.