Fig. 11.
Download original image
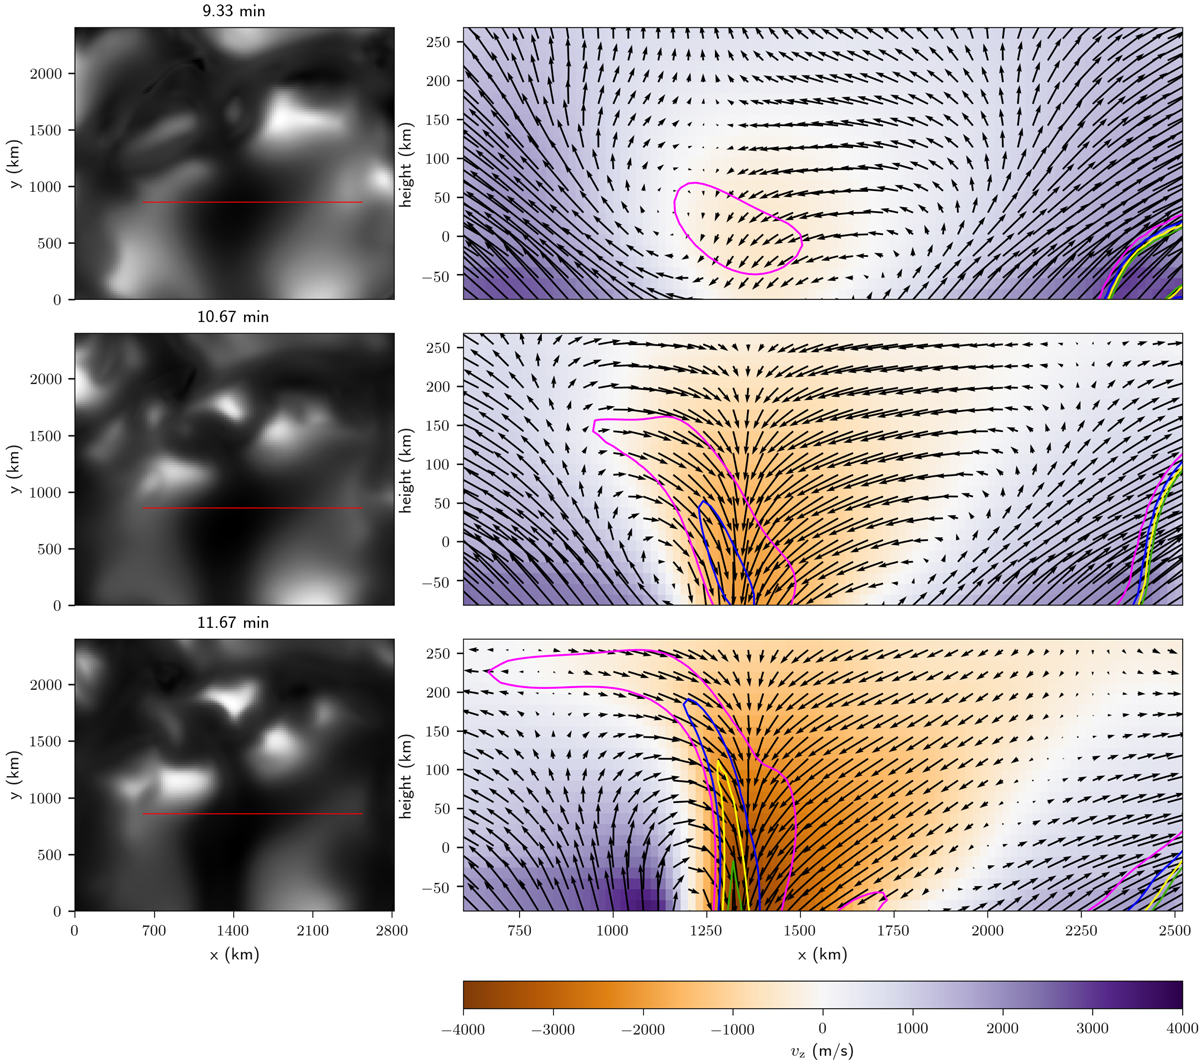
Left column: temperature maps at 0 km height of the simulation box showing the development of the dark core within the exploding granule shown in Fig. 8 for different times. The same time t = 0 is chosen for both plots. Right column: cut through the x − z − plane of the atmosphere along the red line in the images on the left. Coloured background shows the vz velocity, and the black arrows represent the projection of the velocity vector onto the x − z − plane. Additional contours show the magnetic field strength at levels of 10 G (pink), 20 G (blue), 30 G (yellow), and 40 G (green).
Current usage metrics show cumulative count of Article Views (full-text article views including HTML views, PDF and ePub downloads, according to the available data) and Abstracts Views on Vision4Press platform.
Data correspond to usage on the plateform after 2015. The current usage metrics is available 48-96 hours after online publication and is updated daily on week days.
Initial download of the metrics may take a while.