Fig. 10.

Download original image
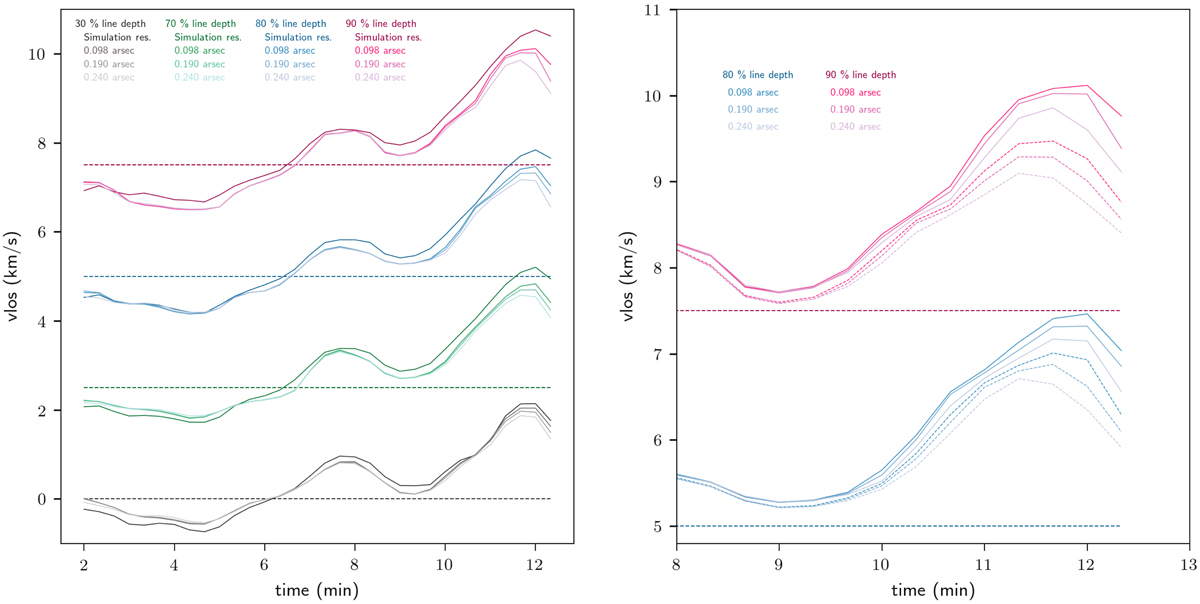
Line-of-sight velocities obtained with a bisector calculation for varying intensity levels of spectral lines synthesised from the MANCHA atmospheres. Left: velocities for non-degraded spectra synthesised at the simulation resolution. The degraded spectrum has undergone spatial and spectral blurring, was re-sampled to an instrumental spectral resolution, and was re-binned to different pixel sizes (see text for details). The curves for the different percentages of the line depth are offset by 2.5 km s−1 for clarity. Dashed lines correspond to 0 km s−1 for the different percentages of the line depth. Right: bisector velocities calculated from synthesised and degraded spectral profiles as in the left image, now shown for only two intensity levels with a spatial blurring employing a Gaussian of FWHM of 120 km (solid lines, same as in left panel) and an FWHM of 240 km (dashed lines). The curves for the different percentages of line depth are offset by 2.5 km s−1 for clarity. The horizontal dashed lines correspond to 0 km s−1 for the different percentages of the line depth.
Current usage metrics show cumulative count of Article Views (full-text article views including HTML views, PDF and ePub downloads, according to the available data) and Abstracts Views on Vision4Press platform.
Data correspond to usage on the plateform after 2015. The current usage metrics is available 48-96 hours after online publication and is updated daily on week days.
Initial download of the metrics may take a while.


