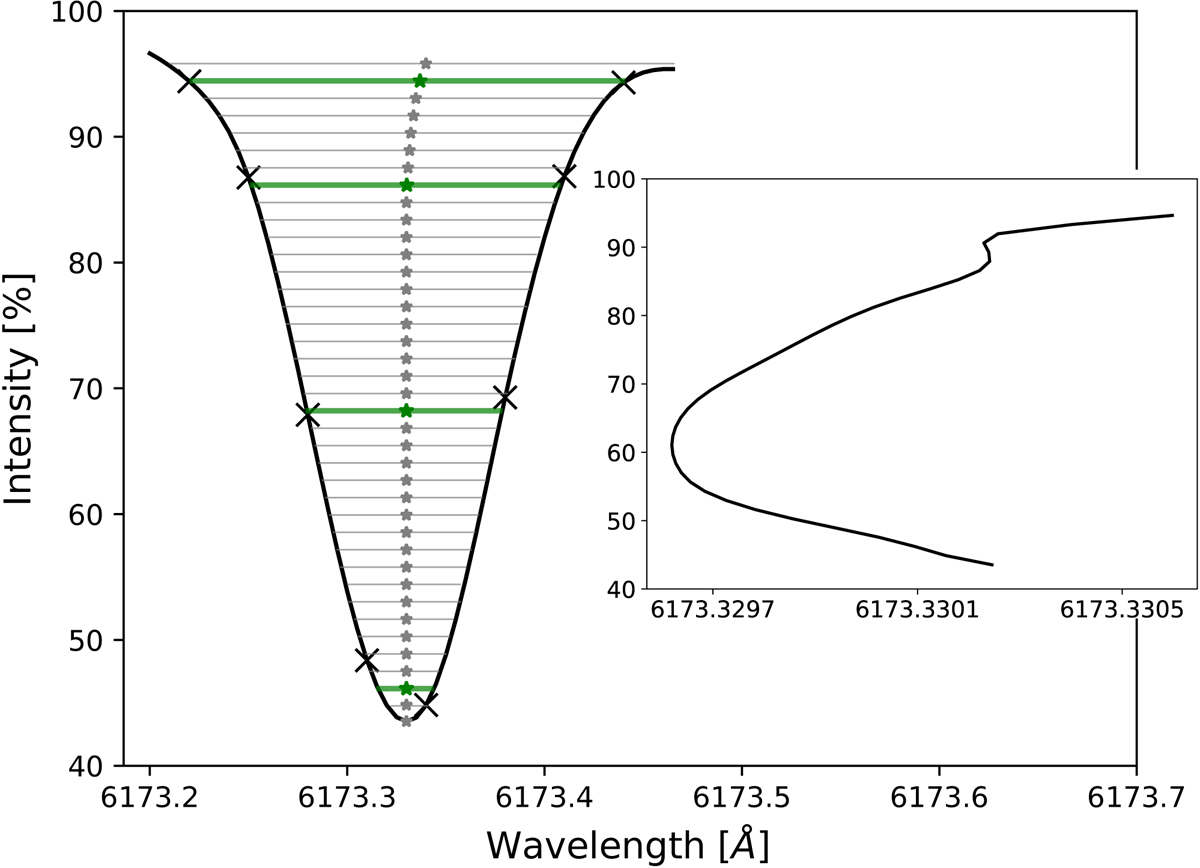
Fig. 1.
Download original image
Line profile of the 6173.0 Å line (IBIS data), where 100% of intensity is designated as an average of the continuum. The crosses denote the spatially and temporally averaged observed line profile, and the solid line corresponds to a cubic spline interpolated profile. The horizontal lines show the calculated bisector levels, where the green lines mark the bisectors that are closest to the observed data points. The asterisk curve illustrates the bisector of the line profile. The smaller image on the right shows the bisector line resolved with an expanded wavelength scale.
Current usage metrics show cumulative count of Article Views (full-text article views including HTML views, PDF and ePub downloads, according to the available data) and Abstracts Views on Vision4Press platform.
Data correspond to usage on the plateform after 2015. The current usage metrics is available 48-96 hours after online publication and is updated daily on week days.
Initial download of the metrics may take a while.