Open Access
Fig. 5.
Download original image
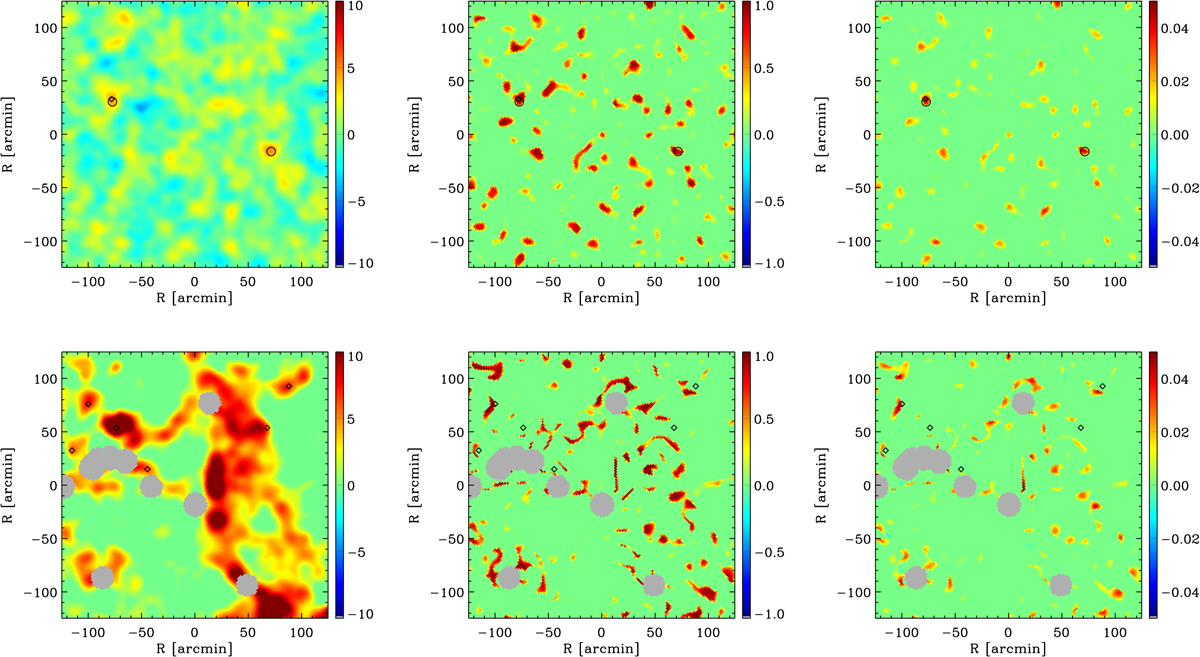
Region of the sky without foreground contamination (upper panels) compared with an area of the sky dominated by galactic contamination (lower panels). From left to right: same as Fig. 4 but for patches of 4.25 × 4.25° centered on galactic coordinates (l, b) = (44.5°, −27.5°) and (l, b) = (122°, 24.5°).
Current usage metrics show cumulative count of Article Views (full-text article views including HTML views, PDF and ePub downloads, according to the available data) and Abstracts Views on Vision4Press platform.
Data correspond to usage on the plateform after 2015. The current usage metrics is available 48-96 hours after online publication and is updated daily on week days.
Initial download of the metrics may take a while.