Fig. 4.
Download original image
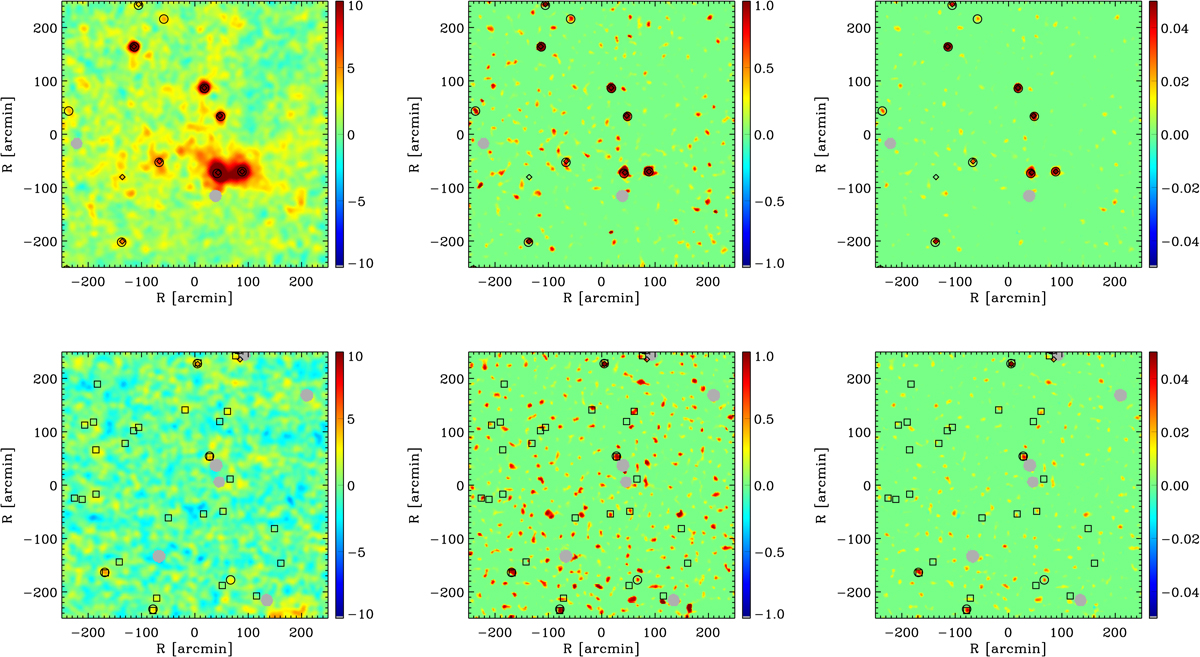
Upper panels: a region of the sky including a nearby multiple-cluster system, lower panels: a region with a large number of clusters identified in the optical within SDSS data. From left to right: Planck tSZ MILCA map, neural network weight, match-filtered MILCANN map, for patches of 8.5 × 8.5° in gnomonic projection centered on galactic coordinates (l, b) = (264°, −24°) and (l, b) = (11.5°, 70°). Gray regions are masked due to point-source contamination. We display objects from the HAD catalog (presented in this paper) as black circles, from the PSZ2 catalog as black diamonds, and from redMaPPer (when available) as black squares.
Current usage metrics show cumulative count of Article Views (full-text article views including HTML views, PDF and ePub downloads, according to the available data) and Abstracts Views on Vision4Press platform.
Data correspond to usage on the plateform after 2015. The current usage metrics is available 48-96 hours after online publication and is updated daily on week days.
Initial download of the metrics may take a while.